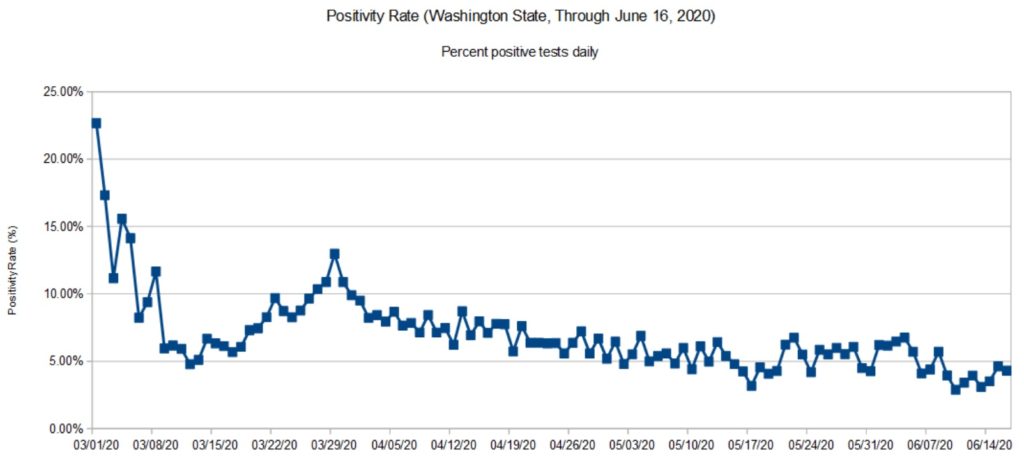
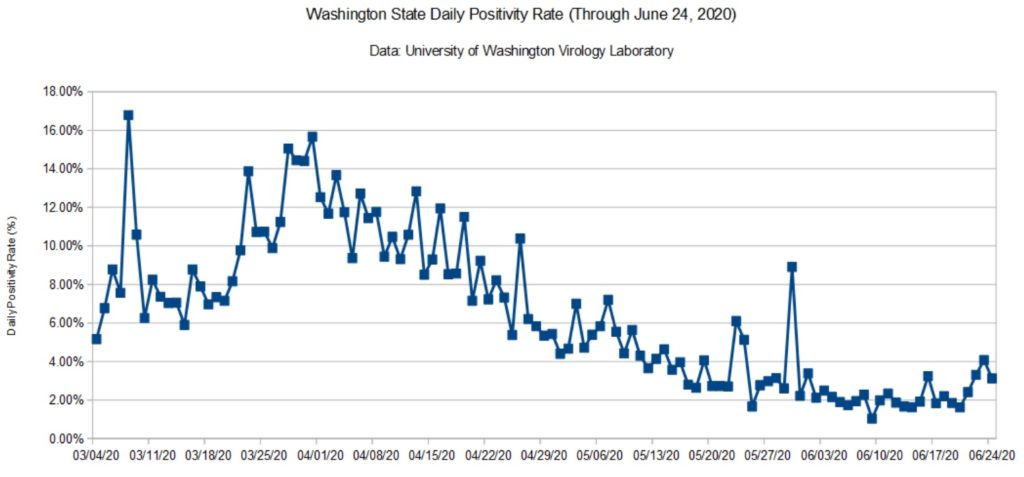
Here is my COVD-19 update taking us through June 24, 2020. Data are taken from the Washington State Department of Health (DOH) and the University of Washington Virology Lab (UW). The DOH data are complete through June 16, 2020 and that is what is shown here. [Click images to enlarge.]


We’re seeing a small uptick which is probably due to the BLM protests in Seattle (early June) and the worsening situation in Yakima County. My daily tracker indicates a roughly 5% positivity rate that is consistent with the charts above.
The recently announced NY/NJ/CT travel quarantine initially included Washington State. That really surprised me and sent me diving into the data. However, it appears that the NY/NJ/CT authorities reacted to a temporary “condition” in the data. Giving them the benefit of the doubt, the DOH did a massive update recently, taking seriology tests out of the daily testing statistics. I took a numerical tour of the hottest states recently and was appalled at the inconsistency and shortcomings in reporting. (CDC? Hello? Anybody home?) Confusion is somewhat understandable.
Please mask up — P.J. Drongowski
