
Here is my latest update for the COVID-19 positivity rate in Washington State. The Department of Health (DOH) data are relatively complete through June 6, 2020 and the University of Washington Virology Lab (UW) data are complete through June 14. [Click images to enlarge.]
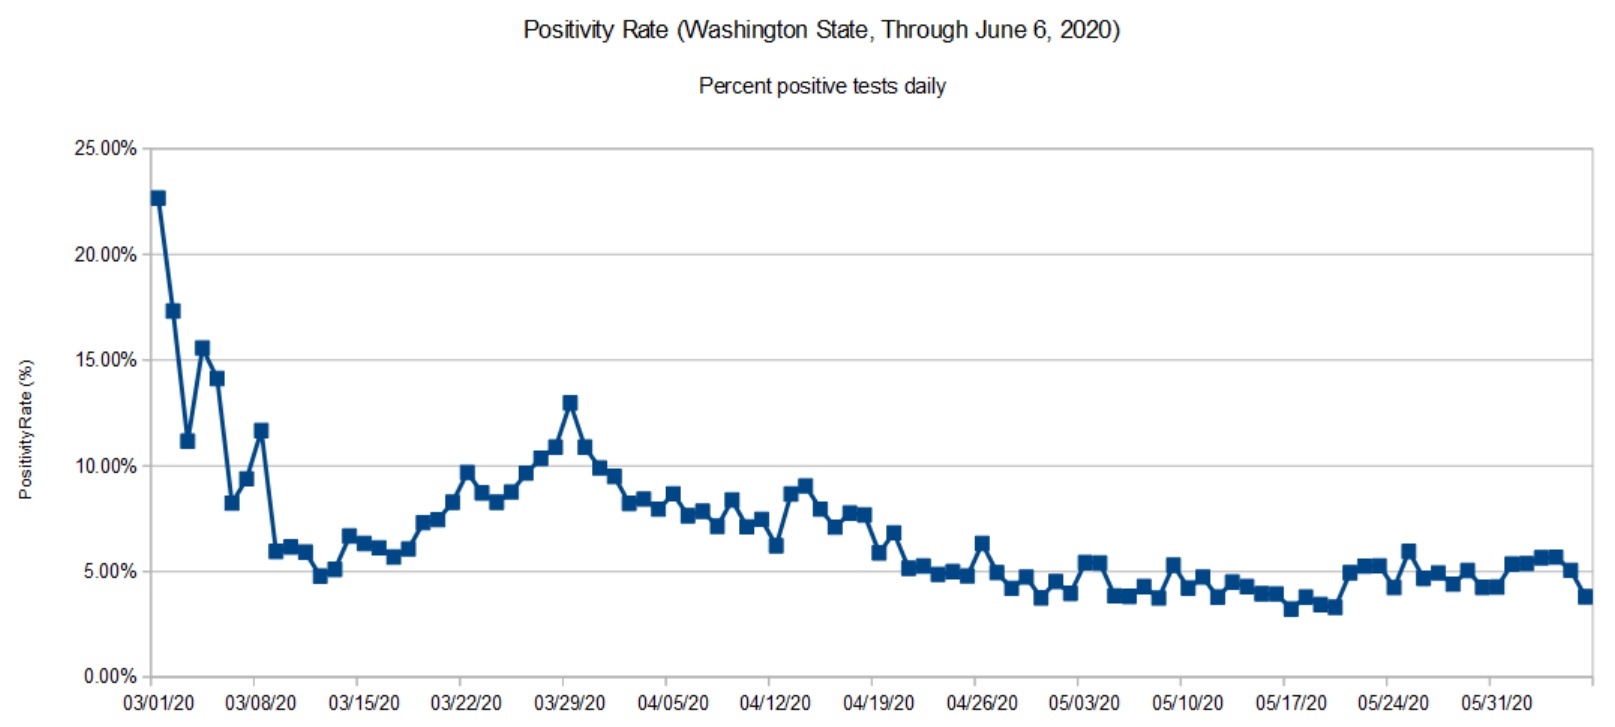
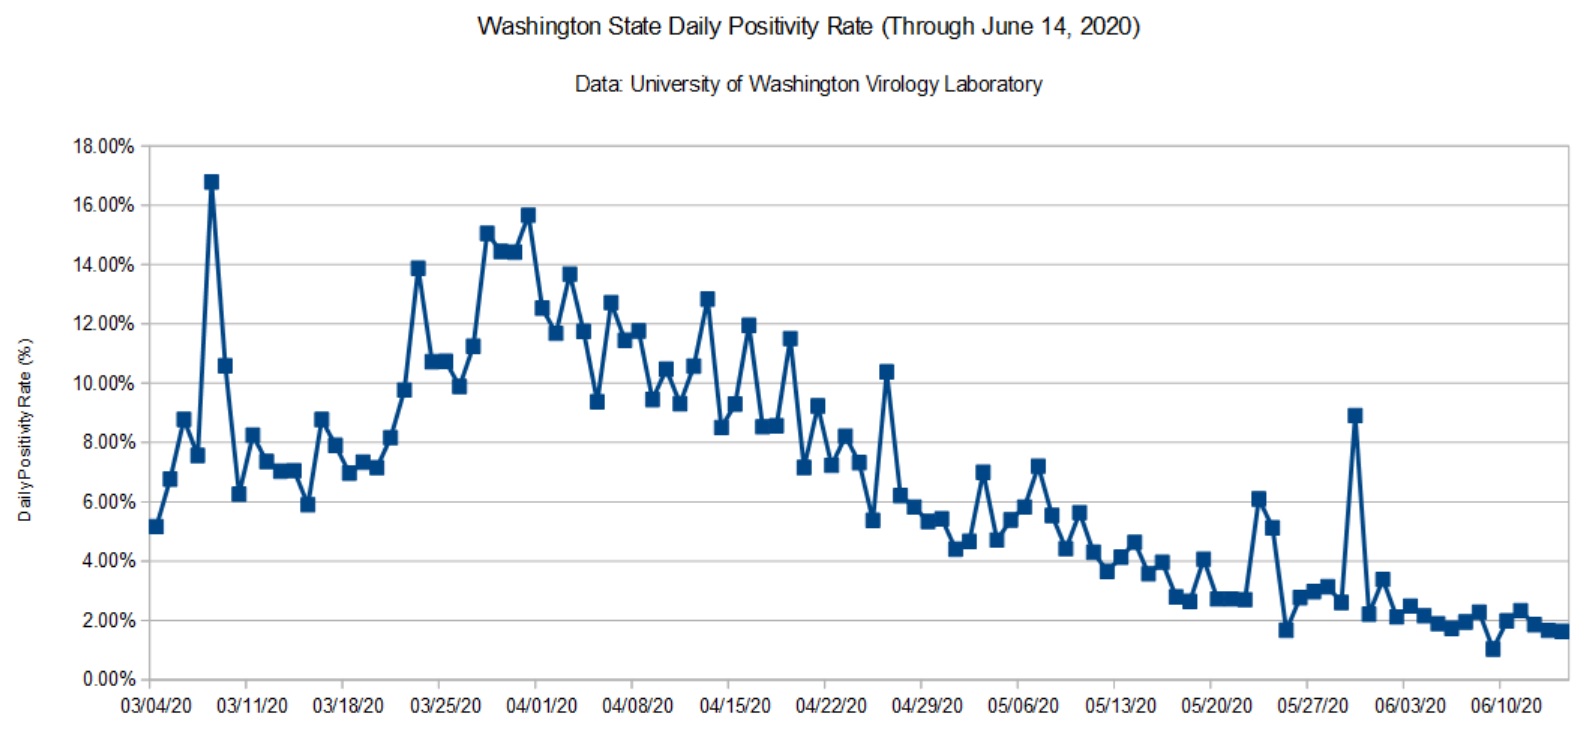
The DOH rate was roughly 5% at the beginning of June. The UW rate is slightly lower, around 3%. The UW rate and my daily tracker do not indicate a rise due to the recent protests in Seattle (King County). I hope the rate remains low or declines further.
Washington State has added considerable test capacity in recent days. During most of May, the State performed about 4,000 to 5,000 tests per day. Now, the State is performing about 10,000 tests per day. The UW dashboard shows a big increase in their test capacity.
Although the situation in King and Snohomish Counties has improved, a few counties in eastern Washington — most notably, Yakima County — are deteriorating.
Mobility
INRIX is a traffic management company which bases its analysis on road sensors and vehicle data. As a public service, INRIX posts an analysis for nationwide vehicle travel data to assist the COVID-19 fight. I recommend visiting the INRIX COVID-19 pages. You will find several informative tables like the one below, plus a national heat map depicting the change in travel at a few snapshot dates (April 11, May 24, May 29).
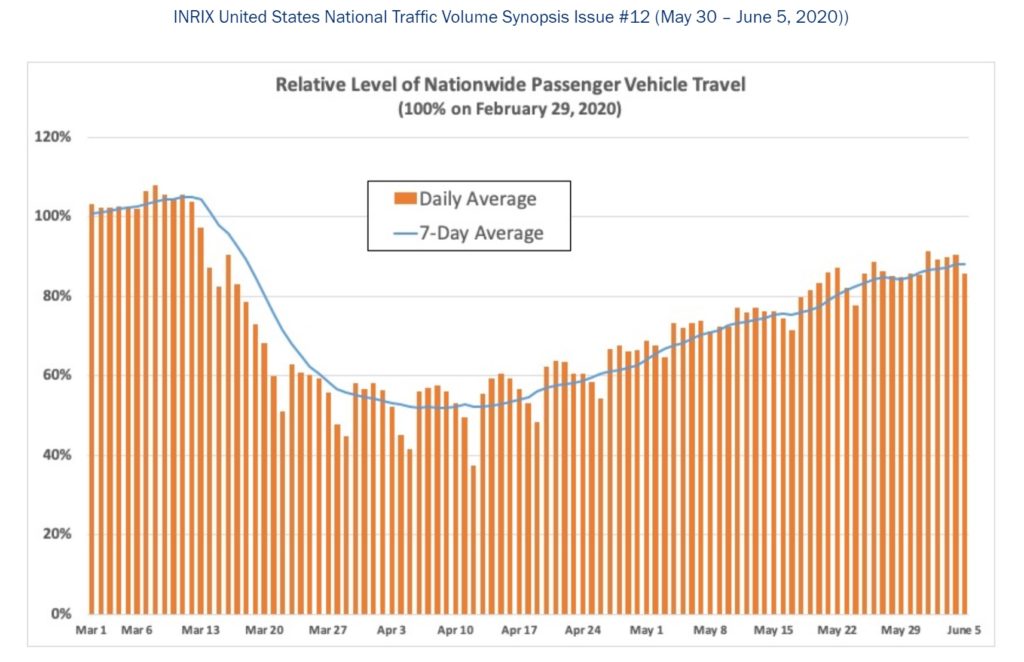
Traffic volume hit a lull in early April and has been steadily increasing in many parts of the United States. Travel is still lower in certain urban centers, especially those which were hardest hit by COVID-19. Rural travel has come roaring back.
INRIX has heat maps for key urban centers. So, if you want to see how your city is doing, be sure to visit their pages. The Seattle area heat map shows higher traffic, which is consistent with my personal (anecdotal) observations.
Stay healthy — P.J. Drongowski