
The Washington State Department of Health (DOH) and the University of Washington Virology Laboratory have done some data cleaning in recent weeks. I decided to bite the bullet and import the latest data from both sites. I also updated my spreadsheet — changes that were long overdue. [Click images to enlarge.]

The DOH positivity has taken a definite upswing during the last week. Folks are getting antsy and highway traffic is noticeably heavier. The morning traffic report is back to yellow and red trouble spots on the local highways. Mobility has definitely increased as we will probably see in the next report from the Institute for Disease Modeling.
It will be 10 to 14 days before we see the effect of protests in the Seattle area. Large gatherings of people are definitely spreader events.
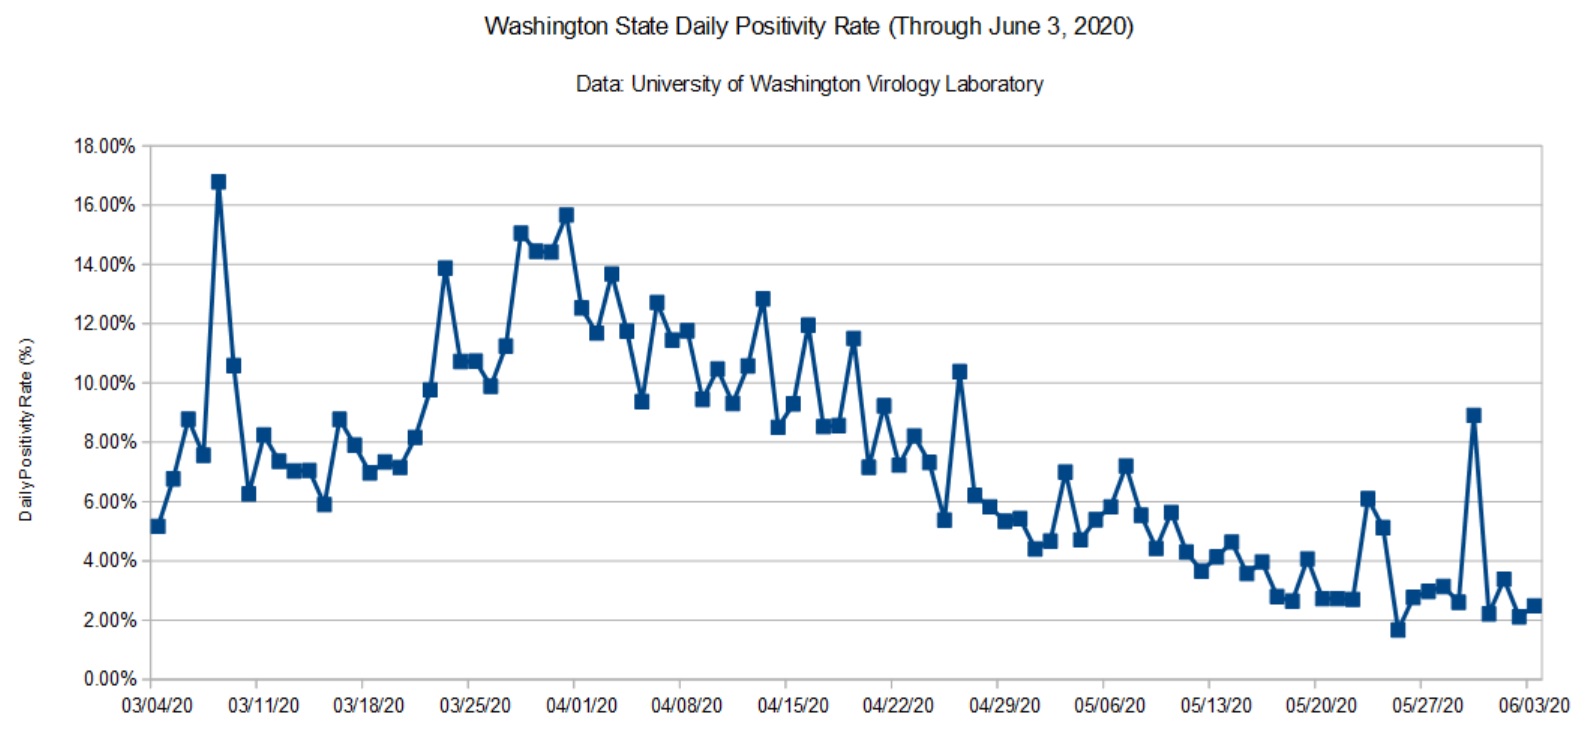
The data from UW had a localized bump. This may be the result of contact tracing within a cluster. I wish the UW site was a little more informative, but interpretation is really DOH’s job.
I still see and hear local media reporting observations like “The number of cases dropped dramatically yesterday.” Raw case counts are relatively meaningless unless the number of tests are taken into account. That’s why I’m tracking the daily positivity rate — the percentage of positive test results for each day.
Here’s an example to show what I mean. Testing (and reporting) dips over the weekend. The number of weekend (Saturday and Sunday) tests is typically less than half of weekday tests. Here are the mostly values reported in the media
               Cumulative                  Daily
       --------------------------   ----------------------
Date   Positive  Negative   Tests   Positive  Tests  Rate
-----  --------  --------  ------   --------  -----  -----
Jun 1     22157    346642  368799        180   3527  5.10%
Jun 2     22484    354843  377327        327   8528  3.83%
The first three columns are the cumulative metrics published by DOH. The last three columns are the number of positive tests, tests performed and positivity rate for each day. The date is the reporting date, so June 1 (Monday) covers the preceding Sunday.
Please note how fewer tests are performed on Sunday than Monday. Sure, the number of raw positive cases on Sunday is dramatically lower Monday. However, the positivity rate is higher for Sunday is actually higher. Yep, the local news station was touting the Sunday number! This is fundamental numeracy, people.
Please stay healthy — P.J. Drongowski