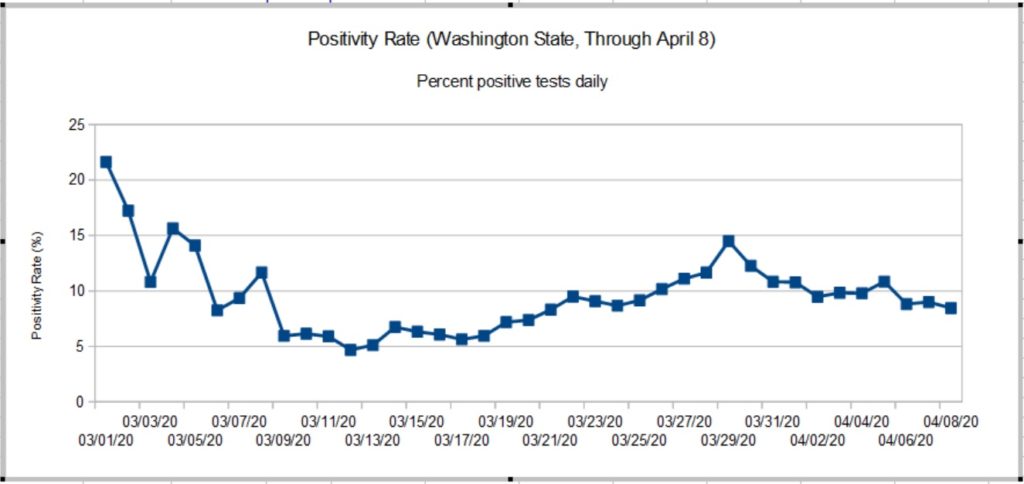
My weekly chart showing the positivity rate for Washington State is a tad late. The Washington Department of Health (DOH) has been busy fixing and upgrading its web site. The new site is a quite an improvement with informative charts, graphs and tables.
Looking at their data, I can appreciate the depth of their collection and reporting problems. Their old database was a “peacetime” tool, collecting positive results from a few of Washington’s many counties. In the fight against COVID-19, all counties are reporting at once and epidemiologists and decision makers want and need additional data about the number of tests, sex, age, etc. Of course, doing all of this work in the middle of a crisis must raise the IT stress level!
The state DOH site now reports detailed testing information in the form of a bar chart. The bar chart shows the number of positive and negative tests each day based on specimen date. This is a meaningful time base as it allows a snapshot of the positivity rate on a given day. It’s much harder to organize test data in this way than just lumping test results willy-nilly as they come in. (See “stress level” above.)
Because all test results for a given specimen day do not arrive at once, the DOH doesn’t guarantee complete results for the days just past. In keeping with their approach, my graph shows the Washington State positivity rate through April 8, 2020. [Click to enlarge graph.]

The true peak in the rate occurred on March 28-29, 2020 when it hit 14.49%. The positivity rate has been slowly declining since then. The peak rate was more than double the 5% to 6% rate established around March 10. The new chart agrees reasonably well with raw statistics from the University of Washington Virology Laboratory. UW results, of course, are large portion of the State’s results. A back-of-the-envelope estimate shows that the rate has improved after April 8. Stay tuned.
So, what about those high rates in early March?
The positivity rate is a rather poor indicator which is subject to bias. COVID-19 tests are only administered under certain specific conditions because testing is rationed. Criteria include COVID-19 symptoms (fever, cough, tiredness, difficulty breathing) or contact with a known infected person. Properly, first responders may be given preference since they are most likely to come into contact with infectious people who may or may not be symptomatic. Further, COVID-19 hits nursing homes with vulnerable residents early and hard.
The general public has not been tested in a systematic epidemiological study, i.e., a random sampling of the population at large. Thus, the positivity rate as measured here is imperfect and may not accurately represent what the disease itself is doing in the overall community.
Contact is an important biasing factor and it is why I do not consider results in early March to be baseline. Public health authorities were actively pursuing contacts in early March after the first case of community spread was detected. The number of daily tests ranged from 74 to 500 — small numbers which are easily skewed.
As I’ve mentioned in earlier posts, today’s statistics tell us what the disease was doing 10 to 14 days ago due to the time required for incubation, development of symptoms, clinical presentation, and testing. Washington’s first community mitigation measures went into effect on March 11, with home-stay recommended on March 16 and home-stay ordered on March 16. I think we can safely say “Community mitigation works.”
Now we need the patience to finish the job and win the fight.
Stay distant and stay healthy — P.J. Drongowski
