COVID-19 Numeracy: Testing

Current situation: 18 March 2020

The United States continues to struggle with COVID-19 testing. Communities do not have sufficient COVID-19 test kits and they are, effectively, rationing tests. Generally, a patient must satisfy several criteria before a COVID-19 test is authorized and performed. Example criteria include cough, fever (high temperature), shortness of breadth, exposure to an infected individual, or travel to a known COVID-19 hot-spot. A patient may be tested first for influenza, receiving a COVID-19 test after influenza is ruled out, i.e., the patient fails the flu test.

Even in the face of shortage, the number of COVID-19 tests performed each day is steadily increasing albeit slowly.

With the current situation in mind, let’s look at few metrics.

Media reports

The most frequently reported statistics are the cumulative number of confirmed COVID-19 cases and the number of deaths due to coronavirus. A few news organizations report the number of new confirmed cases for the preceeding 24 hour period (AKA “per day”).

Most numerate people realize that “If you test, you will find the disease.” If you test more, then the raw number of confirmed cases will also rise.

Very few news organizations report the total number of tests performed per day as well as the number of new confirmed cases per day. Lacking the number of tests performed for each day, one cannot put the number of new confirmed cases in context. Nor can an investigator determine a trend over time, i.e., , is community mitigation (e.g., social distancing, etc.) controlling the spread of COVID-19?

We should insist on receiving three per-day metrics: the number of tests performed that day, the number of new confirmed cases and the number of negative cases. The number of tests performed will tell us if COVID-19 test capacity has improved or not. Then, I recommend computing, tracking and comparing the ratio of new per-day COVID-19 cases (confirmed positives) divided by the number of tests performed that day. The ratio better indicates the growth (or decline) of the disease in the community.

The Washington State Department of Health does report a daily break down. Their page breaks out confirmed cases by county, by age and by sex. The Department of Health also provides testing information. Unfortunately, the number of individuals tested, positive and negative are cumulative. As of March 17, the test figures are:

  • Positive: 1,012
  • Negative: 13,117
  • Individuals tested: 14,129 (Positive+Negative)
  • Percent positive: 1,012 / 14,129 = 7.7%

Please give us nonaggregated results for each day!

Beware sampling bias

One might be inclined to interpret the daily percentage of new confirmed cases as the rate of incidence of the disease in the community (the population at large). Unfortunately, the pre-testing criteria guarantee a biased sample. We are testing patients for COVID-19 only if they have symptoms, have a certain risk factor and/or do not have the flu. The ratio may overstate the incidence of disease or, worse, understate the incidence by missing asymptomatic, infected individuals.

The lack of COVID-19 test capacity leaves public health officials in a terrible bind. One would like to randomly sample (test) the population at large in order to estimate the number of infected people (symptomatic and asymptomatic) in the community. This is akin to taking a political poll. We need to select randomly (say, 1,600 people) from the community and test the selected individuals for COVID-19. We estimate the total number of infected people by multiplying the proportion of infected people as measured by sampling (“the poll”) times the overall population size.

One needs the right kind of test, of course. We want to measure current, active infections, not past infections that have resolved (recovered). This leads us (almost) to the classic SIR model (susceptible, infected, recovered) for epidemics — yet another topic! Also, time to ask the Google about “real-time reverse transcription – polymerase chain reaction (RT-PCR)” and COVID-19 testing. Who said self-isolation was uninteresting? 🙂

From statistics theory, 1,600 tests has a margin of error of plus/minus 2.45%. 1,600 tests is a modest number and, unfortunately, we can barely perform medical diagnostic testing let alone conduct a necessary statistical study at this time. Ideally, we would have sufficient capacity to conduct “tracking polls” to determine the overall trend, i.e., are there more (or less) infected people today than last week? Our officials are truly flying blind at the worst possible time.

Recent studies suggest that asymptomatic people are a significant source of new infections. That’s why public health officials are saying, “Act and behave as though you are infected.” We need tests. We need tools.

Stay apart and say healthy — P.J. Drongowski

COVID-19 Numeracy: NYT curve flattening by country

The New York Times published a collection of graphs comparing new COVID-19 cases over time by country. The article asks the question “Which Country Has Flattened the Curve for the Coronavirus?”

If you are interested in COVID-19 numeracy, I suggest reading the comments section. There are good insights there.

Here is my own response.

Thank you for posting your study. I started blogging about “COVID-19 numeracy” in response to the rather poor way media outlets have portrayed the disease numerically. We are in this fight for the long haul (12 to 18 months) and need metrics that guide our actions.

Please listen to the recommendations in this comment section. Many of us have spent years in measurement and statistics.

Raw numbers, e.g., the number of (new) confirmed cases, are not always meaningful or useful. We know that the number of new confirmed cases per-day will rise dramatically as testing increases. The number of new confirmed cases needs to be “normalized” against the number of tests performed. I suggest tracking the ratio of new confirmed cases divided by the number of tests.

I strongly agree that we need to track the progress of COVID-19 on a daily basis. (A seven day moving average is a good idea.) The total (cumulative) number of cases/deaths — as tracked and reported by most media outlets — will not be useful 2, 3, 4 months into the crisis, especially when there will be “waves” of resurgence and subsidence. We need to understand the dynamics of the pandemic.

Health authorities need to report the number of tests per day, the number of positive cases for that day and the number of negative cases. The raw number of tests per day will tell us if authorities are meeting their commitment to increase the number of tests and allow us to compute ratios, etc.

Should we ever get to the point of spare testing capacity beyond diagnosis, we need to conduct periodic community studies, something akin to a political poll. Take a random sample of the community and determine the number of symptomatic and asymptomatic cases (by age, by sex, etc.) Such polling will allow us to track the actual infection rate in the population at large.

COVID-19: KPI

First off, I would like to say how sad I am for those who have lost their lives to COVID-19, offering my support and empathy to their loved ones. We live in Sonomish County, Washington, not very far from King County and Kirkland. We’ve already seen the devastation which COVID-19 can wreak on care facilities for elderly people. This disease is all too real.

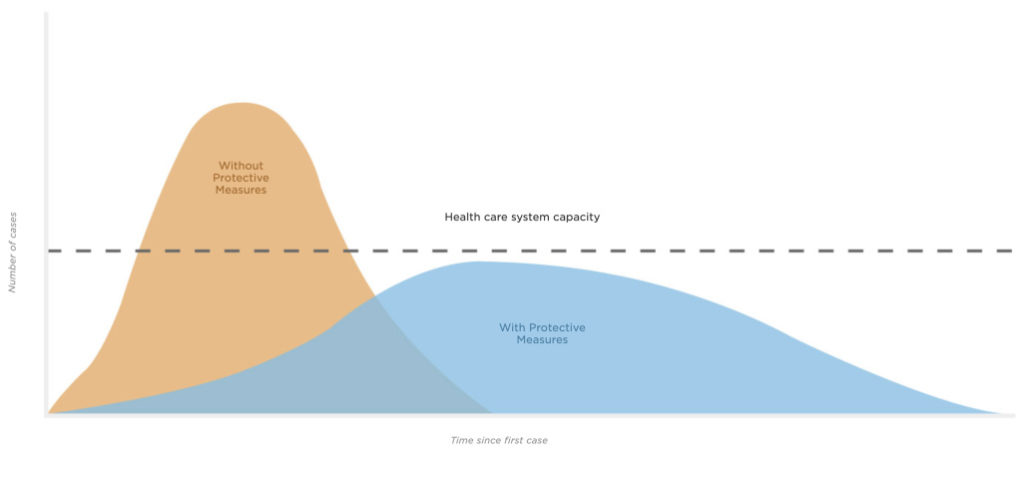
By now, you’ve heard the phrase “flattening the curve” and have probably seen the graph from the CDC (below). Our global goal is to slow the spread of COVID-19 through the population such that severe cases do not overwhelm the health care system. In a nutshell, the health care system has a fixed number of beds, doctors, nurses, caretakers, respirator, ventilators, etc. When capacity is exhausted, the system cannot treat all incoming patients (COVID-19 plus the regular, on-going stream of emergency situations like heart attacks, strokes, etc.) and, quite frankly, people will die.


Source: CDC, Drew Harris (Connie Hanzhang Jin/NPR)

The graph has done a good job of educating us as to the need for social distancing, hygiene, and other measures which slow the spread of disease.

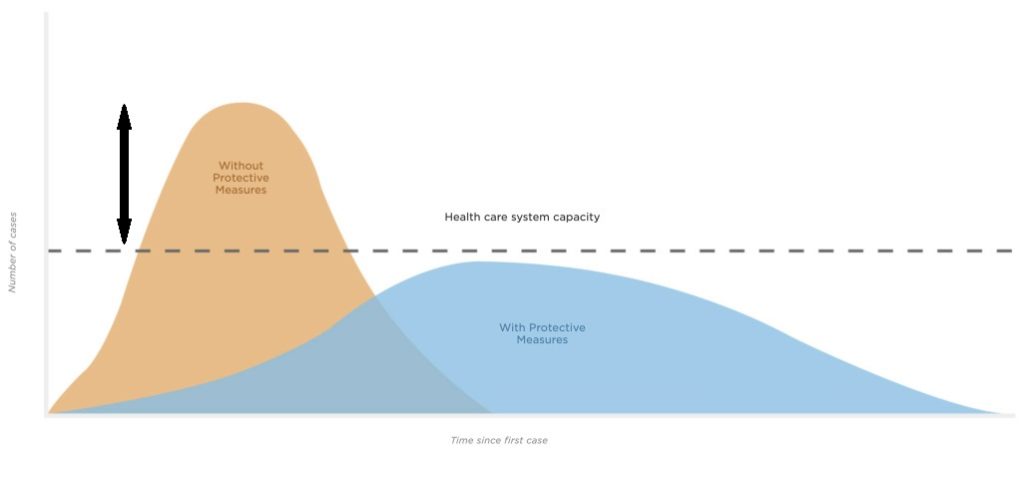
It also suggests a metric — a key performance indicator (KPI) — which can tell us how well we are doing. A KPI is a measurable value that demonstrates how effectively an organization is achieving its objective(s). It’s important to note that a KPI can and should be applied at different levels in the organization. We also need to know how the KPI changes over time.

Let’s consider a KPI which measures the number of all critical care patients above or below the capacity of the health care system (below). This delta tells us if we are successfully suppressing the spread of COVID-19 or not. We must measure all critical care patients because they all are vying for the same medical personnel, beds and equipment. If the KPI is positive, i.e., the number of critical care cases exceeds capacity, then we are failing. If the KPI is negative, then we are succeeding.

COVID-19 Key Performance Indicator (KPI)

A national KPI value is only somewhat useful. The KPI needs to be measured at the state level and regional (metro) level. State-level values are useful only for small states such as Rhode Island with one major population center. Regional-level values are more useful in large states like California or Washington with two or more major population (and health care) centers. The U.S. is a very large country and health care capacity in West Virginia, for example, is not available to residents in San Francisco. Thus, regional numerical break out is required.

We need to track the KPI over time. The trend will tell us if we are successfully supressing the spread of COVID-19 or not. Tracking by region over time will tell us if hot spots are cooling off or if new hot spots are developing.

Why am I proposing this KPI, especially now? As a people, we need to walk a fine line between actionable concern and fearful panic.

I see tables and graphics in the media which tally the total number of confirmed cases and the total number of deaths. Yes, we mourn the loss of our neighbors. If we have even an ounce of humanity, can we not? I agree that such figures convey the sense of urgency needed to motivate new behavior that slows the spread of disease.

However, the total number of confirmed cases and fatalities alone are flawed measures for decision making. With respect to confirmed cases, the number can only go up — drastically — as we ramp up testing. Media need to at least report the number of people tested each day along with the number of negative results as well as the number of new confirmed cases. Even then, perhaps only the ratio of new confirmed cases to the number of new tests is truly meaningful.

Just to be clear, “each day” means the number of people tested, confirmed positive and negative in a specific 24 hour period, not an accumulated tally to date.

Aggregated and accumulated measurements are not practical and may be unnecessarily misleading. News media please take notice.

We also need to break out and track new critical COVID-19 cases which require hospitalization. These are the people who need the health care system. By tracking this number, we will see if the load on the health care system is trending upward toward catastrophe or trending downward successfully. As much as I love my younger and/or healthier brothers and sisters, if they are successfully recovering in self-isolation, then they are not loading the health care system with negative implications, and possibly death, for critical care patients.

I apologize to anyone who may feel offended by my frank discusion. I’m trying to come to grips with all of the information thrown at me by media outlets. Hopefully, you will find this approach to be useful. Even if you do not adopt my proposal, I hope to have started a practical discussion.

Wishing you safe passage — P.J. Drongowski

Yamaha Genos V2.0 Update

The Yamaha Genosâ„¢ V2.0 update is available for download from your regional Yamaha musical instrument site.

Reading through the list of changes, the Yamaha engineers have changed many of the internal data structures and file formats in order to support new features. Thus, like the MODX update, you will need to save your user data before you install the update. Pay careful attention to these cautionary statements from Yamaha:

“After you’ve updated the firmware to this version, the System, MIDI, User Effect, and Registration data are initialized the first time you start up again.

  • Save the MIDI Setup File and User Effect Setup file before updating, and load after updating.
  • Save Registrations to a file before updating.
  • Even if you save the System Setup file before updating, it cannot be loaded after updating.
  • If you save the Backup data before updating and restore it after updating, the System, MIDI, User Effect and Registration data will not be restored.

Before executing the update, we recommend that you back up important data to an external drive using the backup function or data copy function, in case some trouble occurs.”

The list of changes and fixes is quite long and extensive. This is clearly a major update, if not an upgrade!

I keep everything backed up as I work. I put a lot of time and effort into voice and style programming, and just cannot bear the thought of doing it all over again. I honestly don’t mind making another back-up just in case.

While you’re at the download page, be sure to snag new copies of the Genos Owner’s Manual, Genos Reference Manual and Genos Data List. Also, grab the new version of Yamaha Expansion Manager (YEM) V2.6.0. You must use YEM V2.6.0 with Genos V2.0 firmware. Under the “Other Downloads” section, you’ll find a bonus playlist and documentation for the Genos V2.0 Superior Pack: Bonus Playlist for Genos V2.0 Superior Pack and GENOS V2.0 SUPERIOR PACK List.

A quick glance at the V2.0 Superior Pack List reveals the new EDM and bass voices from the PSR-SX900, the (expected) Super Articulation 2 (SA2) female voices, SA2 soft trombone, SA2 panflute, and a raft of “Alpen” voices. There are six new Mega Voices which signal new samples, too: Klarinette Mega, Trompete Mega, BariHorn Mega, Kontra Tuba Mega, Bass Tuba Mega and OberGtr Mega.

At the time that I’m writing this post (10AM PST), Yamaha have not updated the Genos pages to promote the V2.0 update. The European pages have info about V2.0 including a link to the V2.0 Superior Pack. If you can wait (!), here is a direct link to the V2.0 Superior Pack.

This is a lot to install and mentally unpack. Thank you, Yamaha!

Backed up, installed and running

It took a short while to fully understand Yamaha’s cautionary note. I decided to make a complete back-up file even though the System, MIDI and User Effect set-ups inside would not be reloaded by Genos V2.0. To fill the gap, I saved the MIDI Set-up and User Effect Set-up to files on a USB flash drive. Just to be ultra-safe, I copied my Registrations from the Genos internal USER area to the USB flash drive. I have a lot of time and effort invested in my Registrations and did not want to lose any recent edits. [I keep successive back-ups, so I can roll back to a previous, known-good state, if necessary.]

The System Settings are more of a problem. Genos V1.4 has a way to save the System Settings to a file, but V2.0 will not load pre-V2.0 save files. I followed Yamaha’s advice and studied the Parameter Chart in the Genos Data List PDF. The data stored with a System Set-up are clearly identified. I wrote down a short list of the parameters which I most likely had changed:

  • Compressor
  • EQ
  • Score, Text, etc.
  • Arpeggio
  • Registration Sequence
  • Metronome
  • Live Control
  • Assignable (Home shortcuts, Foot pedal, assignable buttons)

Your list might be different, so I recommend scanning the System Set-up column in the Parameter Chart. I wrote down the current settings in a text file using a personal computer.

After all of this prep, I was ready for the actual installation. I started with a blank USB flash drive and copied the Genos V2.0 update file (GENOSSETUP.PRG) to the USB drive. I plugged the USB drive into the rear HOST TO DEVICE port, held down the Style Control [START/STOP] button, and powered up. Genos found the update file and kicked into the installation process. Several minutes later, the installer said it was OK to power down and I did so.

On power up the first time, I saw a message like “Improper shutdown. Back up data … have been lost.” Gulp! That’s the Genos start-up code checking the consistency of the set-up data. As we were warned by Yamaha, the set-up data was initialized by the installer. After that, load the saved set-up files from the USB flash drive and ran through the System Settings, and started playing. Oddly, my assignable buttons were preserved, but I wouldn’t count on that happening to you. Back up before installing!

All appears to be good. I have music to rehearse, etc., and will eventually post about the Genos V2.0 Superior Pack, the Chord Looper and other new Genos features. I also need to install YEM V2.6.0, a prerequisite for the Superior Pack. Busy, busy.

Don’t forget auto power shutdown. I just heard Genos turn itself off…

Copyright © 2019 Paul J. Drongowski

Yamaha MODX: Inside stuff

Time for a quick look at the MODX internal hardware. I’m going to be brief, so please read my Yamaha Genos articles (main CPU and tone generation) and my Montage internals article for more details and background information.

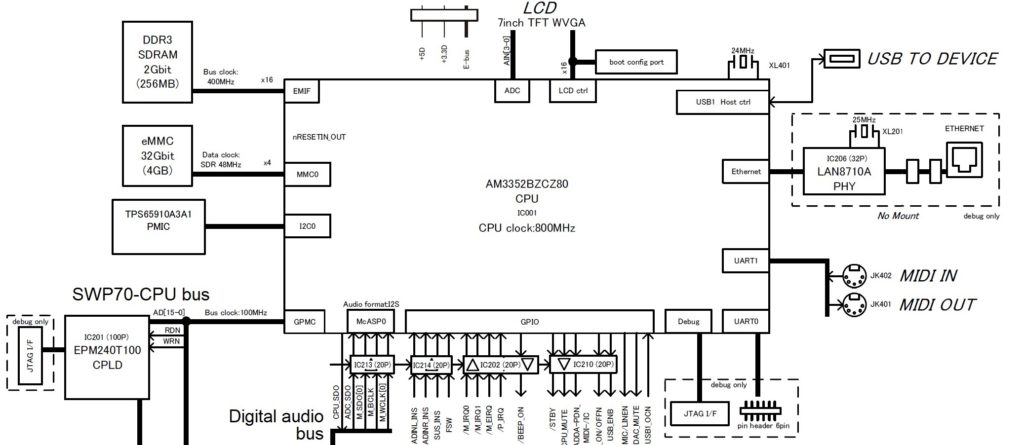
The MODX main CPU subsystem should look familiar. It is essentially the same as the Montage main CPU subsystem. Again, the Texas Instruments AM3352 Sitara ARM microprocessor is the star, providing many of the important internal device interfaces. The eMMC bulk storage device is still 4GBytes although the MODX eMMC data clock is slightly slower than Montage (48MHz instead of 52MHz). Deja vu all over again.

MODX Main CPU (Click to enlarge)

The MODX is a reduced-spec Montage. Although the MODX has the same waveforms and Performances as Montage, its polyphony is less:

  • AWM2: 128 (maximum; stereo/mono waveforms)
  • FM-X: 64 (maximum)

The keybed is lower quality (semi-weighted vs. FSX) and the MODX front panel is greatly simplified.

Both products employ an MB9AF141NA ARM microcontroller for user interface scanning assisted by an 89FM42AUG logic device (E-GKS) for keybed scanning. User input (e.g., controller messages) are sent to the Master SWP70 tone generator over the EBUS. The EBUS is a low-latency path for controller input and commands, making for a responsive instrument with excellent hand-to-sound connection.

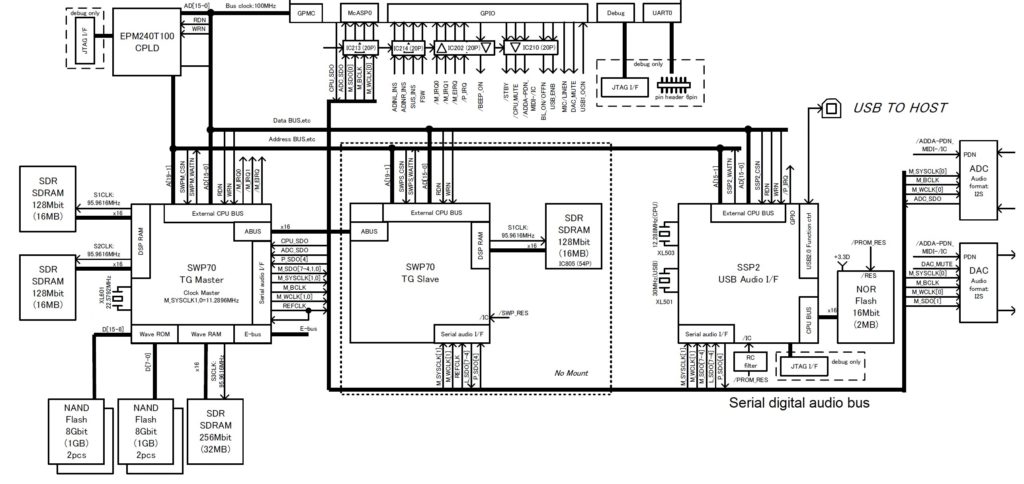
MODX Tone Generation (Click to enlarge)

When we look at the MODX tone generation subsystem, we immediately see why the FM-X spec is lower. The MODX has only one SWP70 tone generator integrated circuit (IC). The Master SWP70 performs both AWM2 and FM-X synthesis. The MODX printed circuit board (PCB) has space and connections for a second SWP70 (in Slave mode), but the real estate is unpopulated (“No Mount”). Yamaha have planned ahead for a future model. They did the same thing with the MOX, BTW, leaving space and connections that were filled in the MOXF.

The extra computational capacity within a single SWP70 is surprising! The Master SWP70 provides 128 channels of AWM2 polyphony and 64 channels of FM-X polyphony. In order to pull off this trick, Yamaha utilize a second dedicated DSP RAM channel and SDRAM. Montage, on the other hand, utilizes only one DSP RAM channel on each SWP70.

Thus, the SWP70 can expand in two different dimensions:

  • DSP RAM (two dedicated channels max) with a corresponding boost in DSP computation, and
  • Wave RAM (two dedicated channels max) with an as-yet unexploited boost in AWM2 synthesis.

MODX illustrates the first case while Montage has an unpopulated position and connections for a second WAVE working memory channel. Your guess is as good as mine as to how Yamaha will expand and exploit these channels in future products.

The MODX serial digital audio bus is a subset of Montage. An SSP2 processor supports audio-over-USB through the USB TO HOST interface, just like Montage. However, the overall spec is substantially reduced. A single DAC drives the MAIN and PHONE outputs. A single ADC encodes incoming stereo audio from the A/D input. The SSP2 does not have a direct channel to an SSP2; the needed logic device is missing from MODX.

In case you’re wondering about serial audio bus clocking, the bus clock is 11.2896MHz. The clock speed is 256 * Fs, where Fs is 44.1kHz. In MODX and Montage engineering-land, this signal is known as M_SYSCLK. Genos engineers refer to this signal as mcasp-256fs. The different terminology doesn’t help comparison across product lines! Bottom line, the master clock is fast enough to support 32-bit 44.1kHz stereo audio. Currently, only the Genos has a 32-bit DAC for its MAIN out, BTW.

Our look inside MODX shows how Yamaha can manufacture the MODX at a lower price point. More significantly, perhaps, is the cost leverage gained by reusing the Montage software and sound content. I think sometimes arguments on the Web play up component cost while neglecting manufacturing, software and sound development costs. I suspect that software and sound development (waveforms, voices, arpeggios, styles, etc.) are a very large fraction of unit cost.

We also caught a glimpse of what’s in store for the future. SWP70 is in early childhood and Yamaha have left room to grow in both the MODX and Montage. In addition to unpopulated PCB sites, Yamaha can build out by using higher capacity NAND flash devices for waveform memory. I’ve said it before — the real limiting factor is Yamaha’s capacity to produce high-quality content — a labor intensive job. Ultimately, the payroll is more important than the cost of commodity NAND flash!

Montage digital audio clocking

I’m still thinking this through…

The Montage USB audio interface supports 44.1kHz, 48kHz and 96kHz sampling frequencies. The number of supported audio channels depends upon the chosen sampling frequency as defined in the specs:

“[Sampling Frequency = 44.1kHz] Input: 6 channels (3 stereo channels), Output: 32 channels (16 stereo channels)

[Sampling Frequency = 44.1kHz – 96kHz] Input: 6 channels (3 stereo channels), Output: 8 channels (4 stereo channels) “

The MODX USB audio interface is strictly 44.1kHz supporting:

“Input: 4 channels (2 stereo channels), Output: 10 channels (5 stereo channels)”

The digital audio bus master clock is a multiple of 44.1kHz, so how does Montage handle 48kHz and 96kHz?

The Montage SSP2 processor handles 44.1kHz, 48kHz, and 96kHz internally. The tone generators, however, are 44.1kHz only. A-ha! That explains the function of Montage’s SRC16 gate array. The gate array is clocked at 49.152MHz, which is a multiple of 48kHz. It converts the sample rates and samples between 48/96kHz and 44.1kHz in DAC-A format (2 channels per line).

The schematic notations on SRC16 match the Montage 48/96kHz spec:

Output: SWP->SRC->SSP2 8 channels (stereo 4 channels)
Input: :SSP2->SRC->SWP 6 channels (stereo 3 channels)

Someday I will explore the Montage/MODX subsystems in more depth.

Copyright © 2019 Paul J. Drongowski
Diagrams are from the MODX Service Manual (copyright Yamaha) .

Pacific Northwest Vintage Computer Festival

I apologize for the pause in blog posts. Between travel and prep’ing the house for sale, the last few weeks have been insane. The painters are wrapping up their work today, leaving a little bit of time for writing.

Our trip took us to the Seattle area for a visit with family. Fortunately, our trip coincided with the 2019 Pacific Northwest Vintage Computer Festival. The festival was held at Living Computers Museum + Labs.

The weather was gloriously spring-like (for a New Englander), making the walk from the Link light rail to the museum a pleasure. The festival took over most of the first floor of Living Computers, including the lab space. If you get the opportunity to attend, I recommend it. There are vintage personal computers, workstations, calculators — all sorts of gear, most of it up and running.

A few highlights…

I had a pleasant chat with Josh Dersch who restored and maintains a Three Rivers Perq workstation. The Perq is one of the first “3 M” machines (1 MIP, 1 MByte, 1 mega-pixel). The Perq originated from the electronics lab associated with the Carnegie-Mellon University Computer Science Department during the mid-70s. I worked at the CS department as a computer operator while grinding my way through C-MU as an undergrad. The electronics lab was a source of many innovative systems: one of the first Xerographic printers (the XGP), a vector display replete with C-MU’s own space war game, and the Perq prototype. The principal players took the Perq commercial in 1974 (just as I was graduating, BTW).

The initial prototype was wire-wrapped. The computer machine room had large glass windows into the electronics lab and I remember watching Brian Rosen as he wrapped and debugged massive prototyping boards stuffed with parts. Josh has one of the original prototype boards. The wire density is staggering. At that scale, one really needed to get things wired right the first time because debugging that rat’s nest of wiring was no fun. (Today’s engineers are spoiled with simulators!)

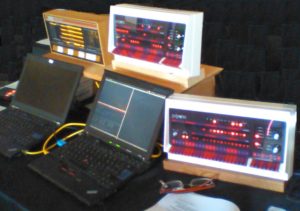
One of the sweetest systems to combine the new and old is the PiDP-11/70. The PiDP-11/70 combines a Raspberry Pi running simh with a beauty, small-scale PDP-11/70 front panel with all the blinken lights and switches. If the 11/70 is too modern for you, try the PiDP-8/I, which is just as spiffy.

Finally, I quite liked the Gigatron TTL Microcomputer by Marcel van Kervinck and Walter Belgers. I acquired a pile of 7400 series logic components in 1976 with the intention of building my own 16-bit processor with an instruction set architecture (ISA) of my own design. It’s still a pile of parts. Marcel and Walter made this dream into a reality. I spoke with Marcel for several minutes and enjoyed hearing about his approach and design choices.

The Vintage Computer Federation organizes and sponsors Vintage Computer Festivals throughout the United States. Check the schedule and visit one!

Copyright © 2019 Paul J. Drongowski

Winter NAMM 2019: Make it redder

Just in case the world isn’t red enough for you, Nord have introduced the Nord Piano Monitor by Audio Pro. [Click image to enlarge.]


The monitors mount directly on the Nord Piano 4 using (optional) mounting brackets. The brackets also allow attachment to mic stands.

Specs are (courtesy of Nord):

  • Dual inputs for keyboard and aux
  • Weight 5,5 kg / pair
  • Tweeter size 3/4″
  • Woofer size 4 1/2″
  • 2 x 80 Watt

I guess that real specs (e.g., frequency response, etc.) and USA pricing will come later.

Audio Pro AB of Sweden make a raft of high-quality consumer speaker systems, including Drumfire which they call “The loudest playing multiroom speaker ($699 USD).

Southside Johnny used a Fender guitar amp with his turntable. He was quoted, “I don’t want good. I want loud.” Loud never goes out of style.

The obligatory video for non-readers. 🙂

Paul Allen: 1953-2018

To be sure, you’ll find many obits for Paul Allen, who died on Monday, October 15, 2018. I’d like to take a moment to reflect on his work and life. Sure, he struck it rich with Microsoft, but he quickly turned to philanthropy after an early bout with cancer. Disease and the Grim Reaper have a way of centering and focusing one’s life and work.

Should you visit the Seattle area, in particular, you’ll see many examples of his charitable work. In addition to “serious” philanthropy, Paul Allen didn’t forget the arts, including pop culture. Most folks know the Museum of Pop Culture, Mr. Allen’s deep interest in rock’n’roll, and his status as a collector.

Collector, indeed. As a dedicated nerd, he created the Living Computer Museum in Seattle to house and preserve computing artifacts. The Museum essentially started out as his personal collection. Its mission has expanded to education and education outreach as reflected in its current name, Living Computers Museums + Labs.

I’ve been fortunate enough to visit Living Computers several times and have enjoyed every visit. I’m a committed preservationist myself and have donated half-a-ton of vintage computers, textbooks, manuals and software to the Museum, courtesy of Mr. Allen’s investment in this worthy venture.

So, let’s take a minute and a breath to reflect and re-center ourselves. Thanks, Mr. Allen.

Roland Drops a Keytar

I’m sure you’ve seen it elsewhere by now…

Special thanks to the chap who posted this image on Gearslutz!

9 pounds, eh? I’m still trying to get rid of my Les Paul copy. Too old for this… 🙂

I did have a chance to check the Roland Juno DS line. Nice mid-range product and can operate on batteries. I’m full up on Roland, so I’ll be passing it by. If you’re looking for a mid-range ‘board, give it a listen. The DS is respectable.

MIDI TRS pin-out

The MIDI Association has released Recommended Practice #54 covering the use of TRS connectors for standard current loop MIDI. If you’re not a member of the MIDI Association, I strongly recommend becoming a member. Among other benefits, members have access to the Association’s on-line specifications and recommended practices.

Without putting too fine a point on it, the diagram from RP#54 says nearly all. [Click image to enlarge.]

MIDI device designers are facing the same sort of space issues as phone developers. The physical form factors are getting too darned small! In many cases — no pun intended — connector size is a limiting factor. Old school 5-pin DIN connectors are enormous relative to slender product envelopes. The MIDI Association recommends 2.5mm TRS connectors and a maximum adapter cable length of 2 meters.

So, of course, you’re wondering about the MIDI controllers, etc. that you already own. A quick check with a digital meter or continuity checker will determine if your current device is consistent with the recommended practice or not. I checked the adapters with my Akai MPX8 and, yep, the adapters are consistent.

The Korg HNS-4331 MIDI conversion cable is also consistent with the RP #54 convention. Albeit, both the Akai and Korg adapters have 3.5mm TRS plug, not 2.5mm. 2.5mm is a good idea since it would be all too easy to plug 3.5mm headphones or a live LINE output into a MIDI port. Yikes!

The IK Multimedia cable that came with my iRig MIDI is a bit of an oddball. First, the 5-pin DIN connector is male, not female as shown in the diagram above. Further, the pin 4 and 5 connections are swapped relative to the pin wiring shown above. So, if you’re wiring for IK Multimedia, please take care and check things out for yourself using a continuity checker.

Sure wish this recommended practice was available a few years ago…

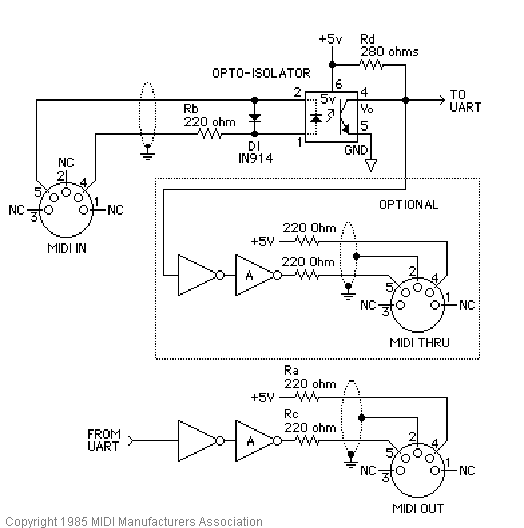
In case you missed it, here’s the MIDI reference circuit.

Please join and be sure to read the 2014 update to the MIDI electrical specification.

Copyright © 2018 Paul J. Drongowski