My post about Arturia Keystep teardown and cleaning attracted a fair number of page views; it must have hit a common chord. 🙂
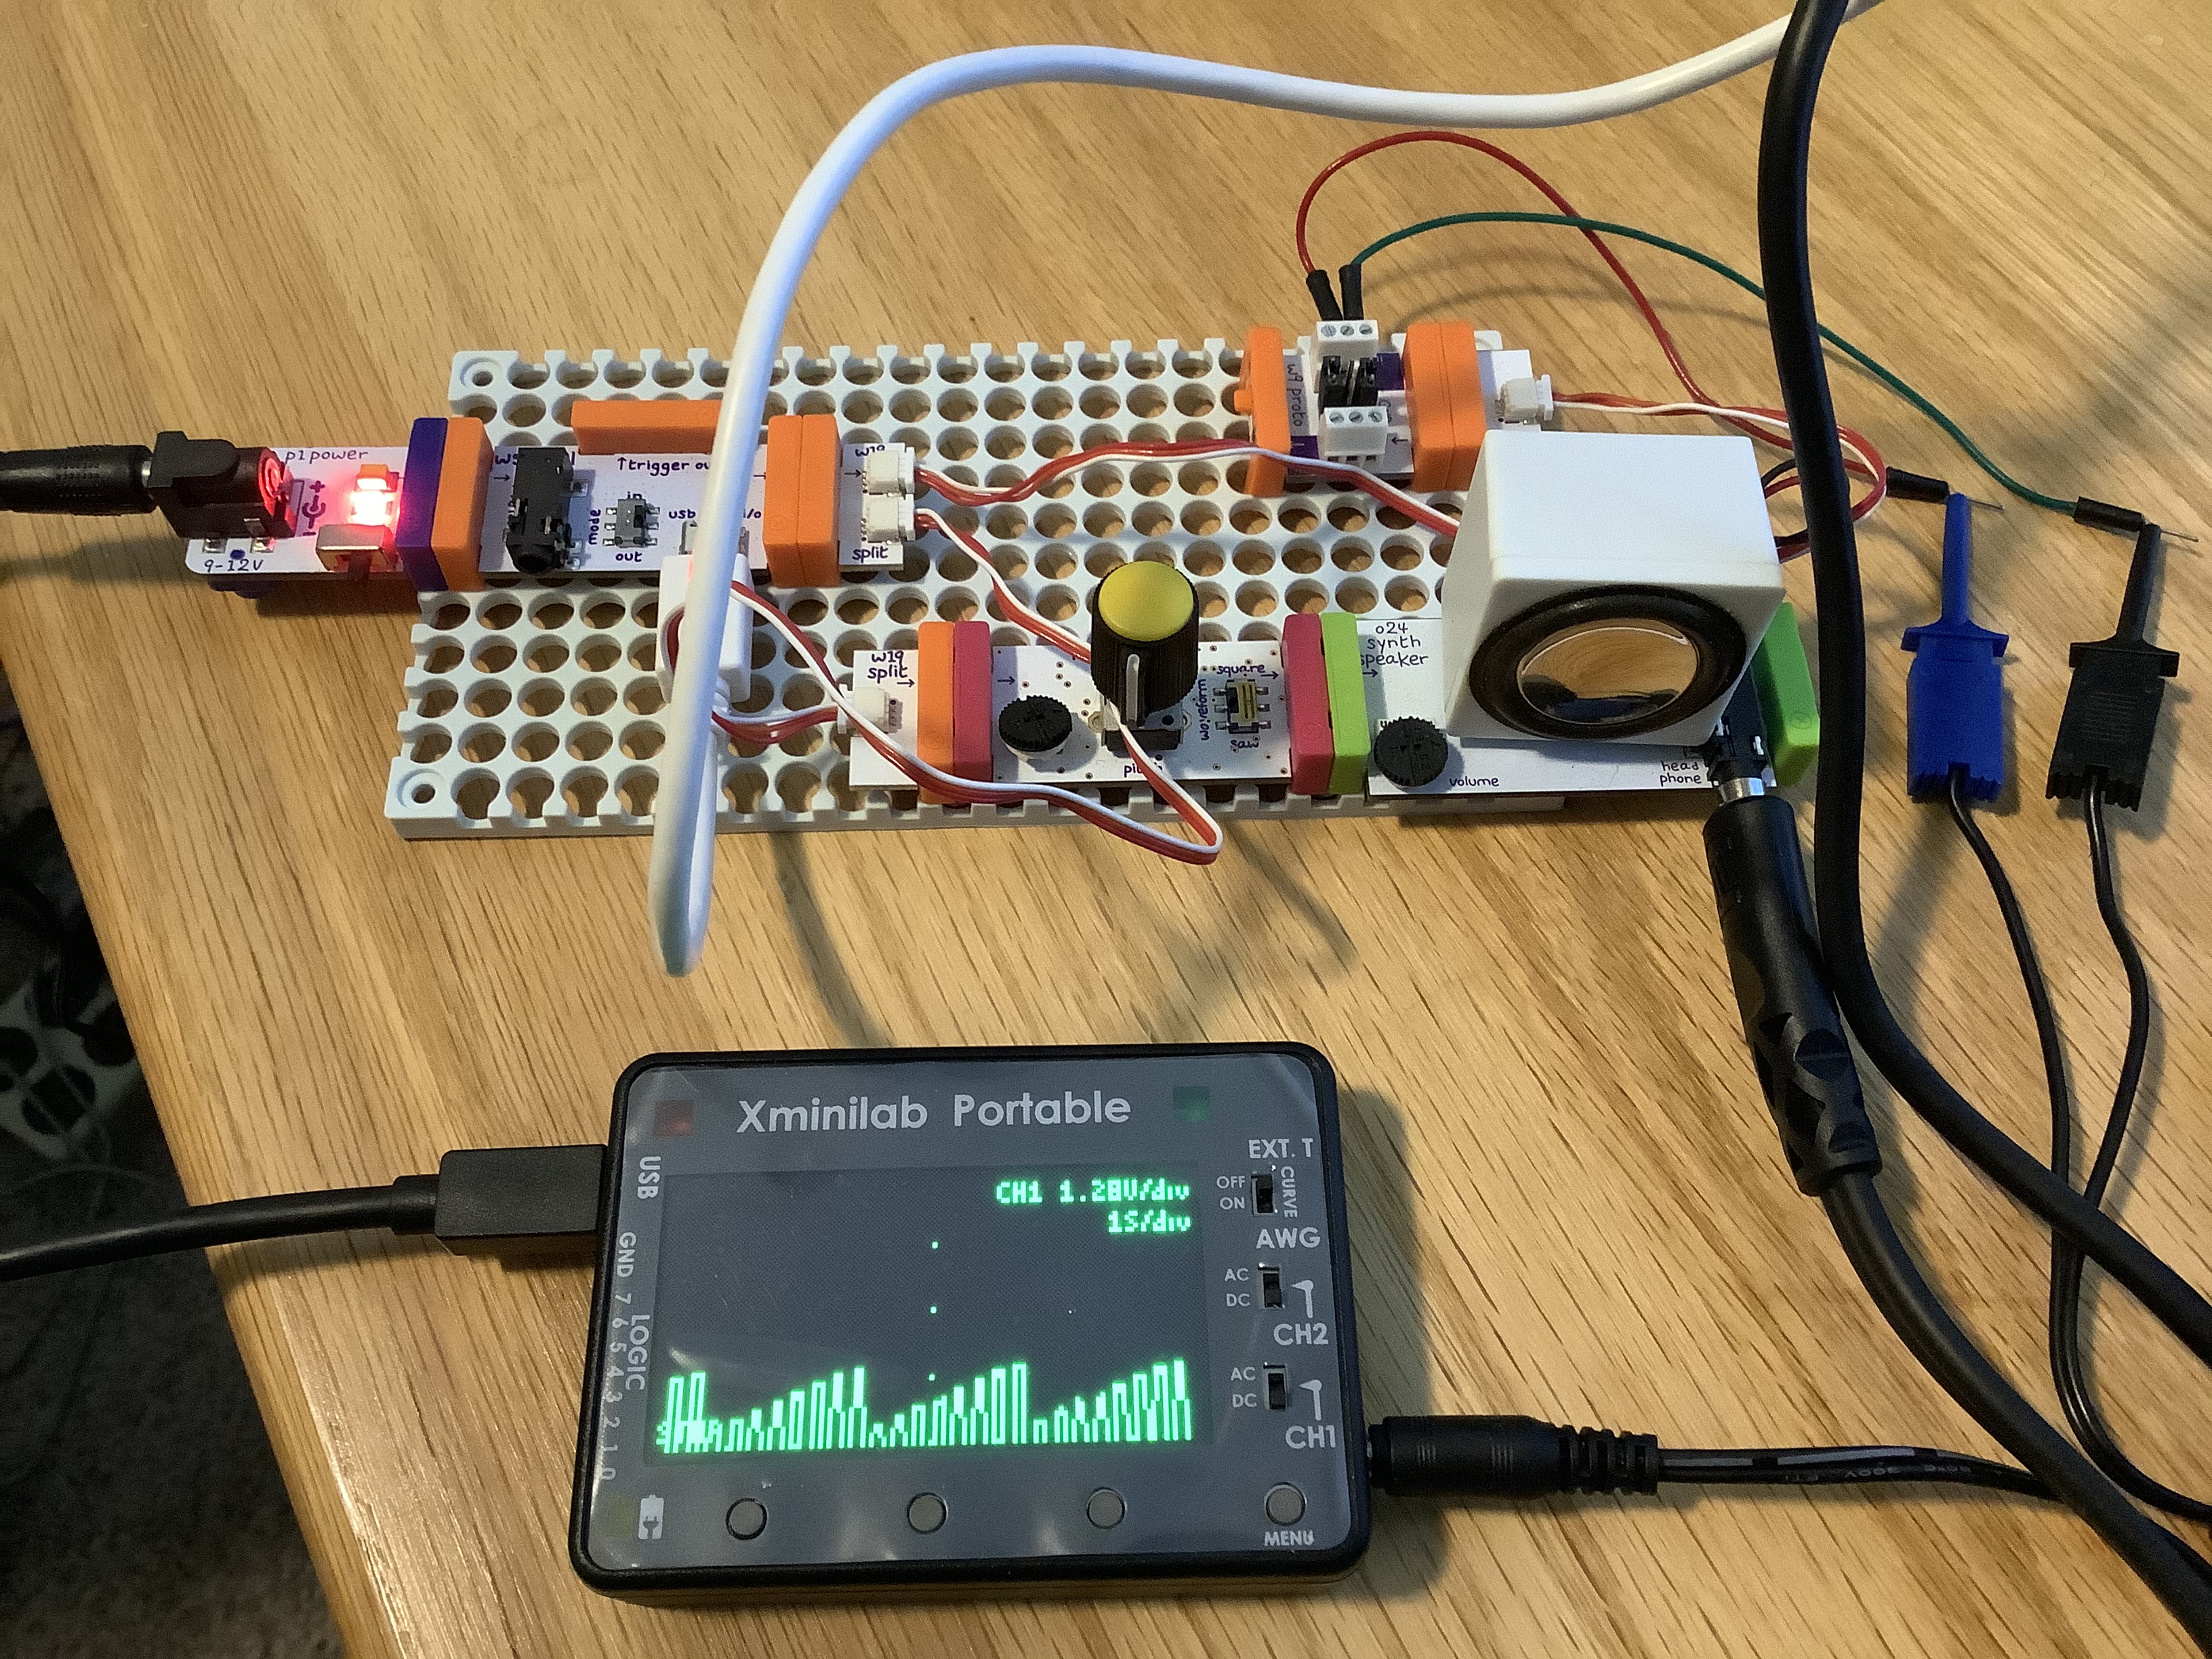
Today’s post continues with Arturia Keystep. Although the Keystep Gate and Pitch control voltage (CV) signals are conventional, I wanted to visualize them with an oscilloscope. I strongly recommend getting an oscilloscope when working in modular synthesis because pictures/graphs help understanding. [We haven’t even gotten to the audio yet!] I connected the Gabotronics Xminilab oscilloscope to the Keystep’s Gate and Pitch CV outputs and took a quick look.
First thing I noticed was a 12V positive trigger level. Holy smokes, I hope I didn’t apply that high signal to littleBits way back when! littleBits modules operate in the 0V to 5V range. Fortunately, littleBits input ports have an ON Semiconductor ESD9L5.0ST5G ESD suppressor/TVS diode, which protect against ESD and transient voltage events. Still, it’s better to configure voltages correctly ahead of time and not risk an accident.
Second thing is that Keystep CV voltages cannot be configured through its front panel. That’s somewhat understandable in a low cost product like Keystep. Control voltages are configured by Arturia’s MIDI Control Center (MCC) software — a free download for Keystep owners.
Here is the control voltage configuration that I used during testing:
- MIDI CV output: Volt per octave
- 0V MIDI note: C1
- Note priority: Last
- MOD CV source: Mod wheel
- MOD CV max voltage: 5V
- Pitch bend range: 2 semitones
- Gate CV output: V-trig 5V
Keystep supports V-trigger 12V and S-trigger in addition to V-trig 5V. S-trigger is the old Moog convention that is not used very much anymore. It’s sometime called “negative trigger,” but it’s really a strange creature requiring a special connector.
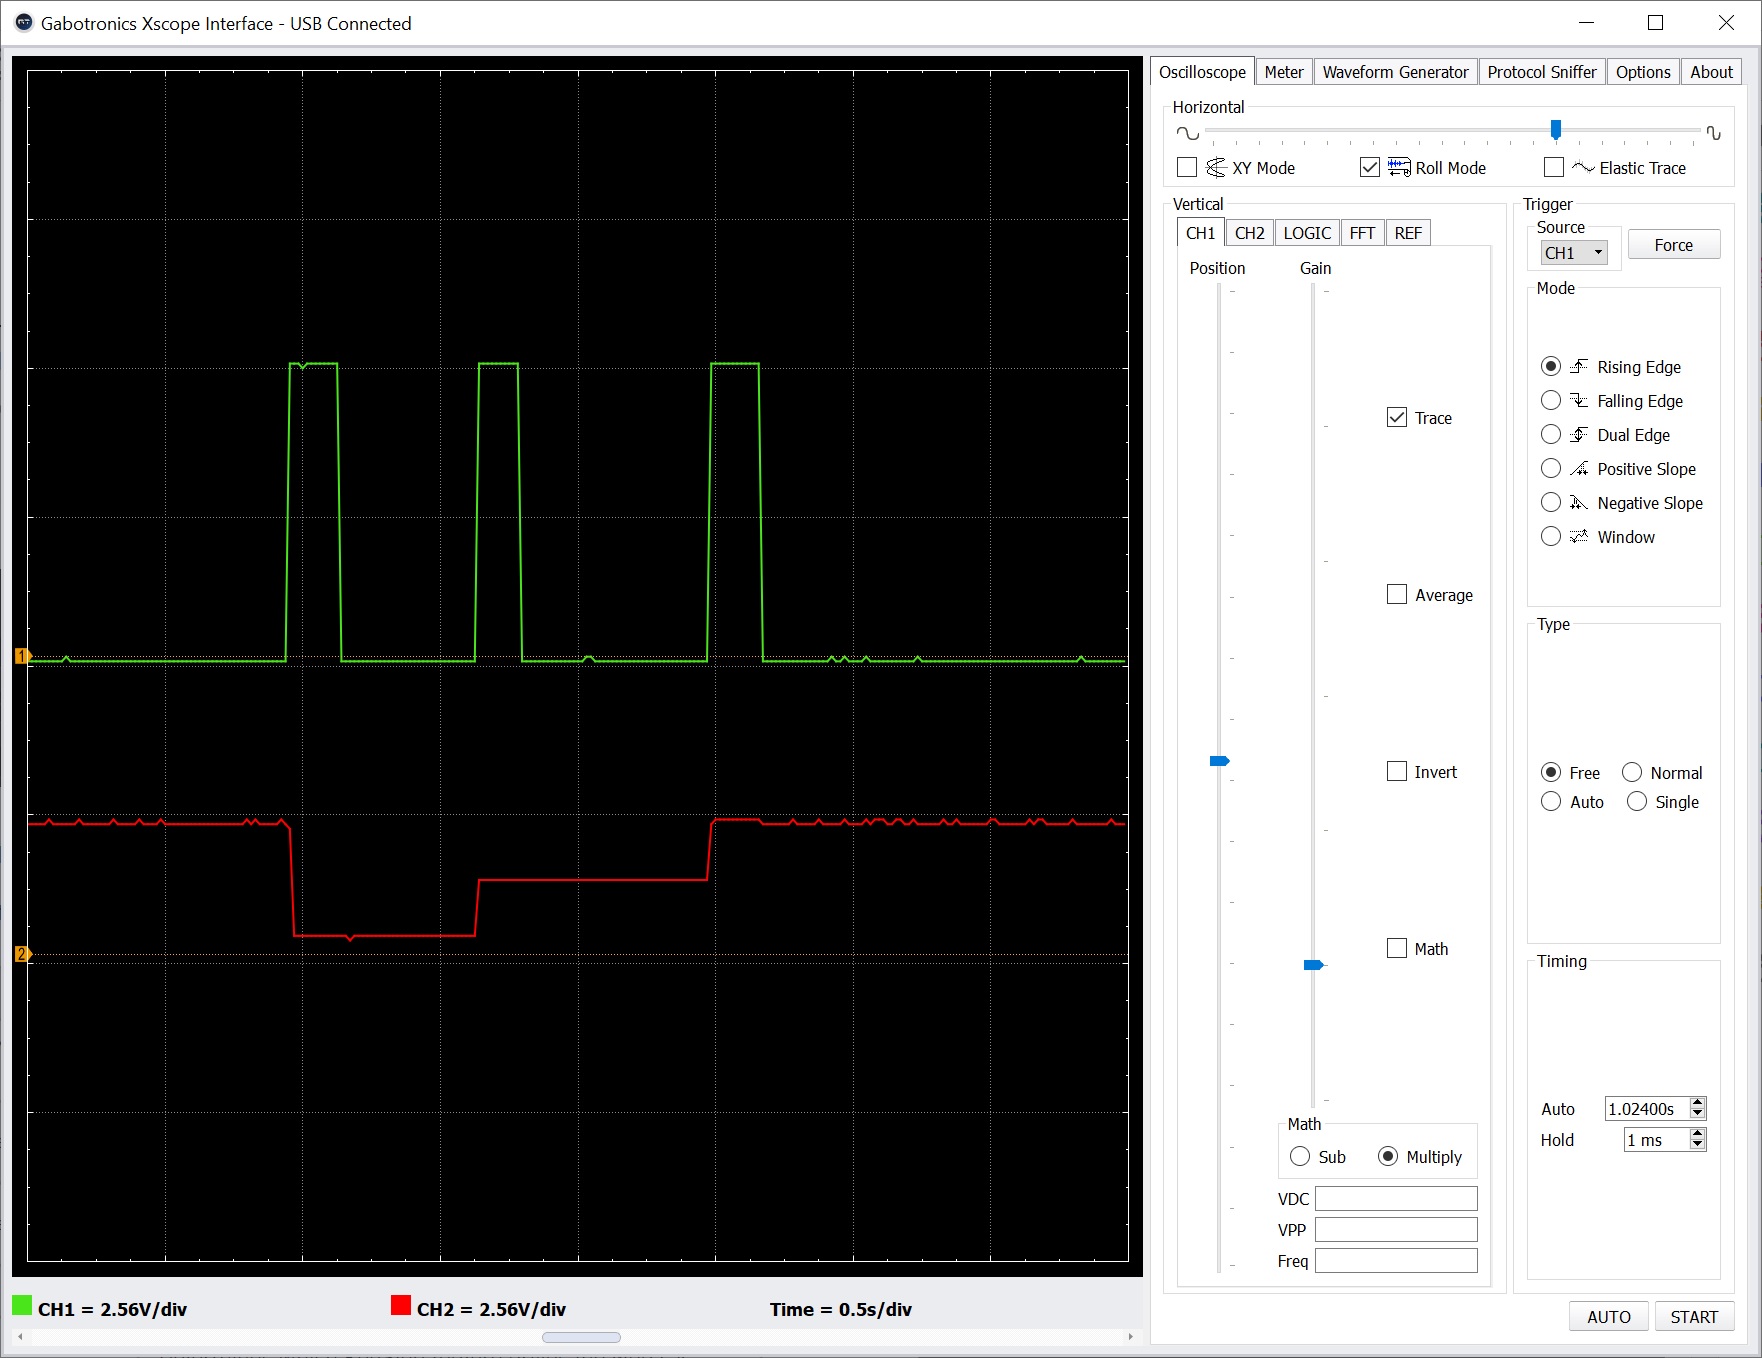
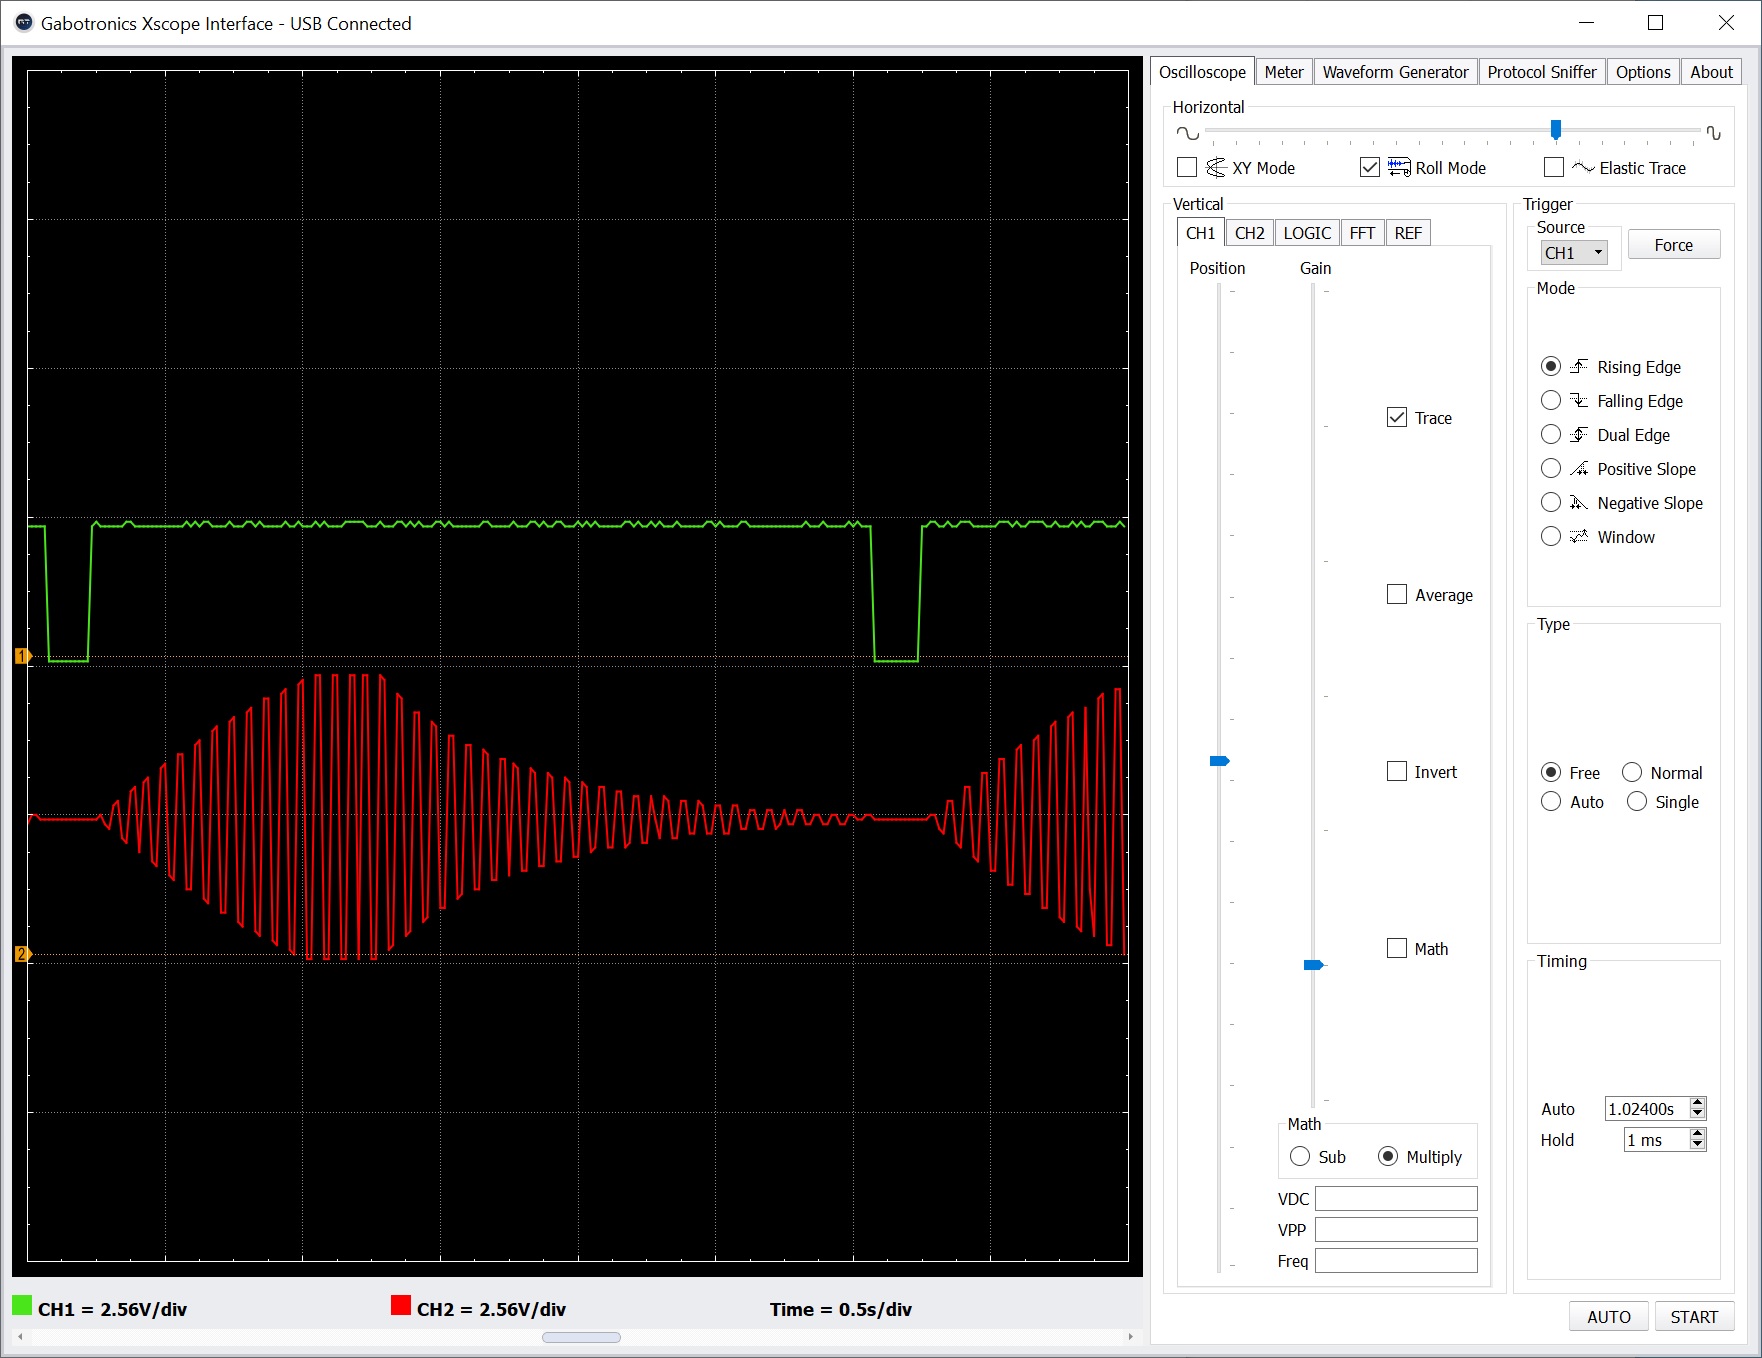
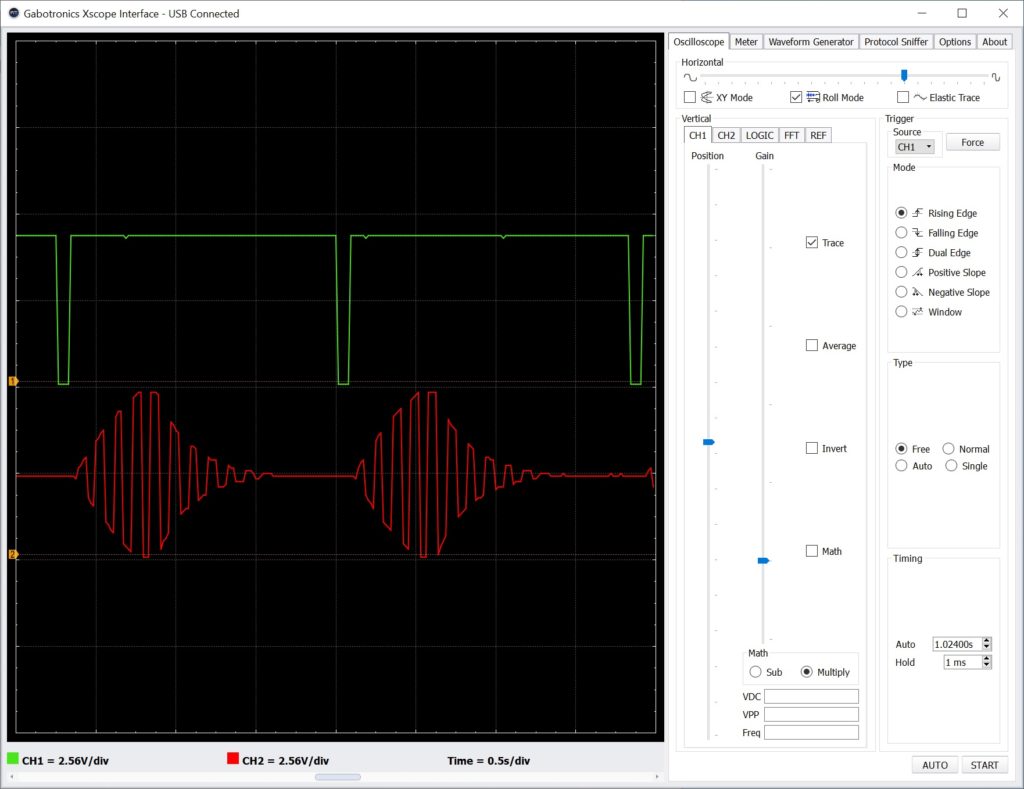
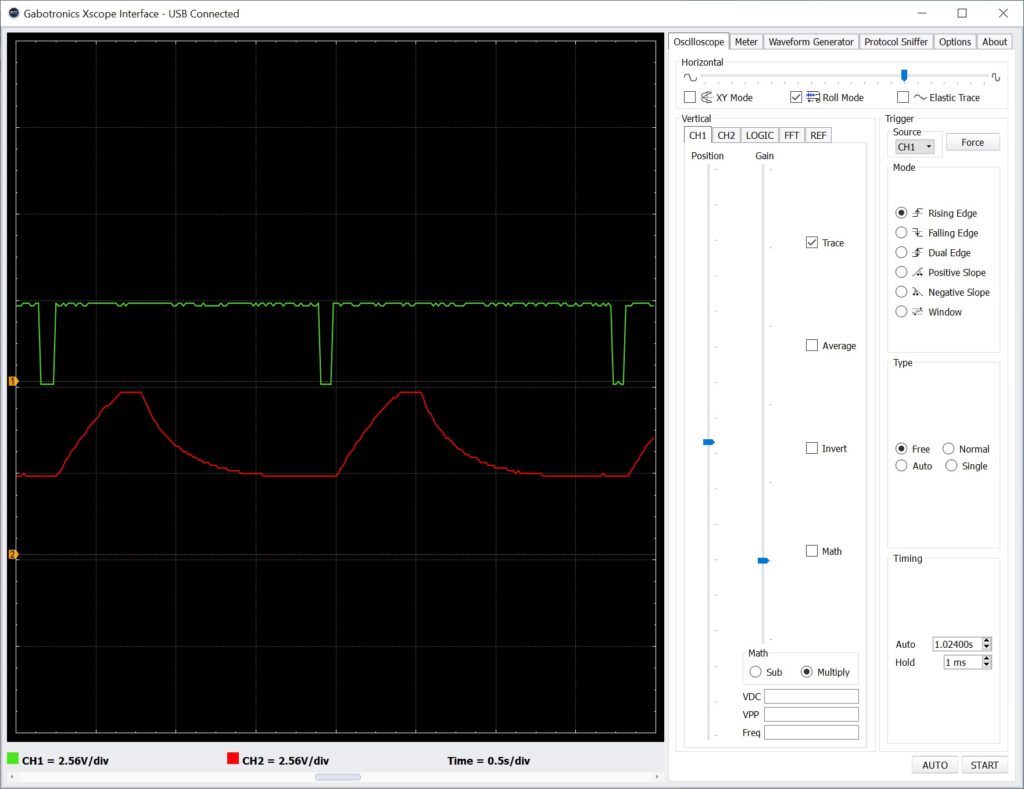
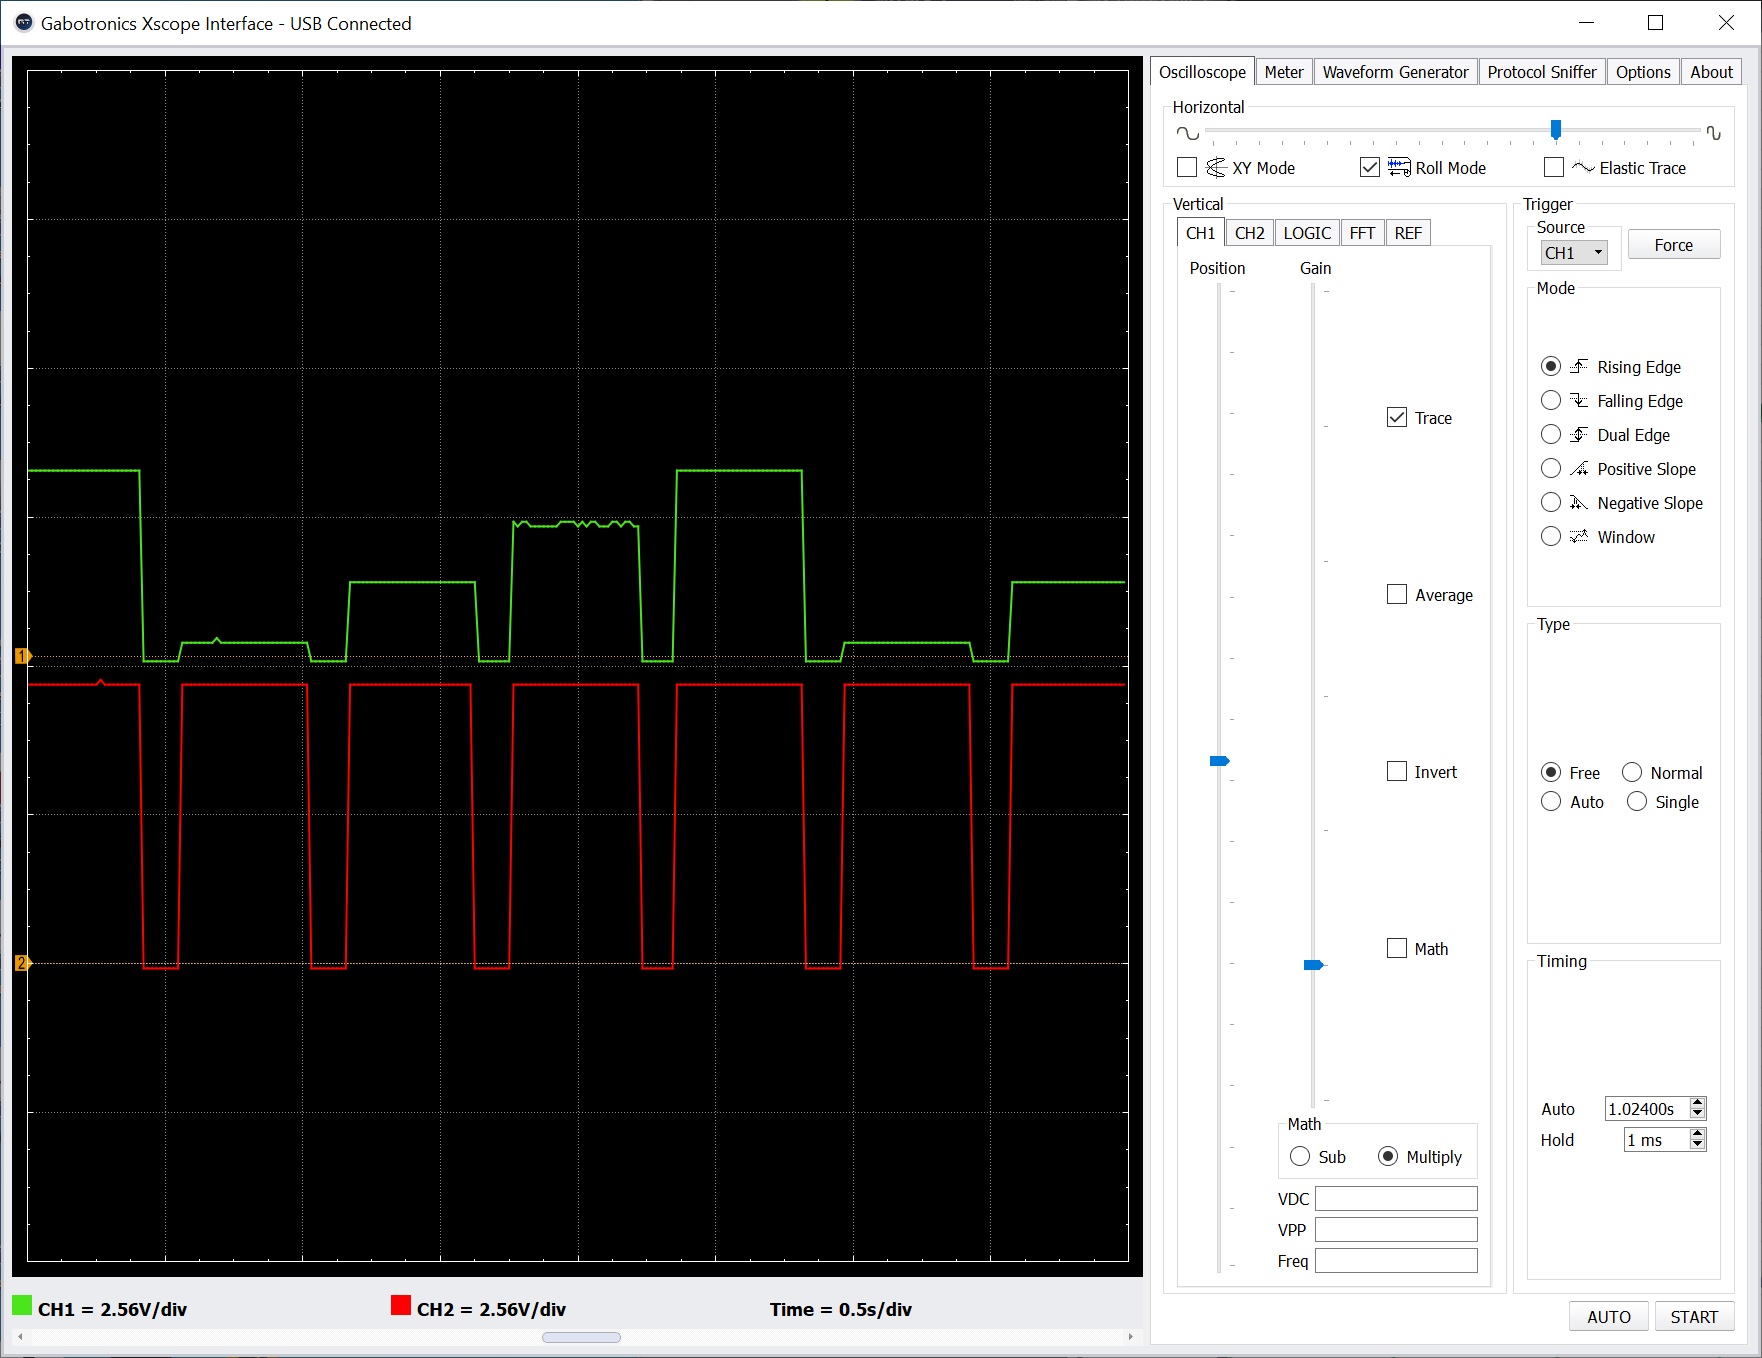
The screenshot above shows the Keystep in action. [Click image to enlarge.] The top trace (green) is the Gate (V-trigger 5V) output and the bottom trace (red) is the Pitch output. The Gate signal is, er, a gate. It goes high when a key is pressed, stays high while the key is held, and goes low when the key is released.
In the example, I played three notes where each note is an octave apart. The vertical oscilloscope scale is 2.56V per grid division. Each step up in the bottom trace (Pitch) is about 1V. Also, you see the Gate signal hit a maximum 5V.
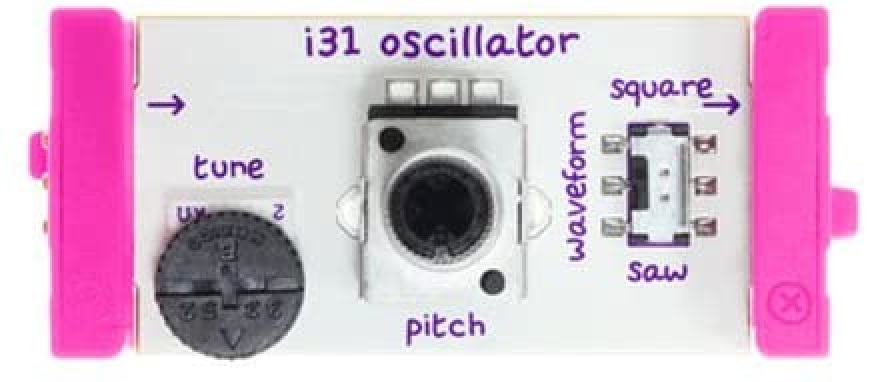
In the future, I may need to tweak Keystep’s 0V MIDI note parameter if I drive the littleBits Oscillator module with the Pitch signal. One needs to find a happy operational sweet spot between Keystep octave transpose and note range versus the limited 5 octave range of the Oscillator module. Keystep’s Pitch signal ranges from 0V to 10V, and I don’t want to drive the littleBits Oscillator with more than 5V, if possible. MCC does not allow us to specify a maximum, do-not-exceed Pitch voltage.
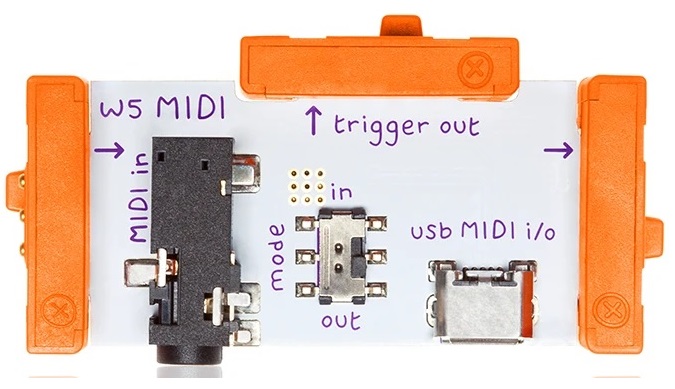
One way around the pitch voltage issue is to control the littleBits Oscillator via the littleBits MIDI Module instead. In that case, the Keystep 5-pin MIDI OUT connects to the MIDI Module (mode switch set to IN) over a Korg convention, 5-pin to 3.5mm adapter. (The O-Coast adapter adheres to the same convention and works, too.) With the MIDI approach, we don’t need to worry about over-driving the Oscillator module with a high, out-of-range voltage. The littleBits MIDI module tops out at 5V.
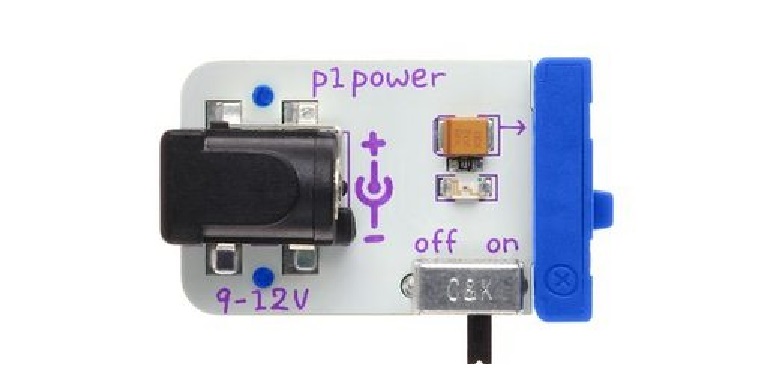
I have both the littleBits MIDI module and littleBits CV module. Thus, I can drive littleBits oscillators via MIDI and send the Keystep MOD CV to the littleBits CV module for modulation duties. With the Keystep MOD CV max voltage set to 5V, I should be safe. If I need to reduce the MOD CV range further, I can always run the output from the littleBits CV module into a littleBits dimmer (potentiometer) and attenuate the level.
The MIDI module approach also produces the gated CV signal expected by littleBits oscillators. The Keystep Pitch output provides a simple, steady voltage level and doesn’t have an in-built gating function. When you hit a key, the Keystep changes the Pitch output voltage accordingly and the Keystep holds that voltage even when the key is released. If connected to a littleBits Oscillator, the Oscillator will never see a release event, that is, the Pitch voltage never drops to 0V when a the key is released. The littleBits Oscillator merrily continues to play! On the other hand in littleBits-world, the gated CV drops to zero. Thus, littleBits combines pitch control and trigger (gate) into a single signal.
One could build a simple converter from separate gate and pitch CV to the littleBits gated CV. I’m thinking of a voltage-controlled SPDT analog switch like the Texas Instruments TS5A9411 (or MAXIM MAX4544, etc.). The trigger (gate) signal controls the switch. When the trigger is low, the signal connects to ground and passes 0V. When the trigger is high, the switch passes the Pitch CV signal.
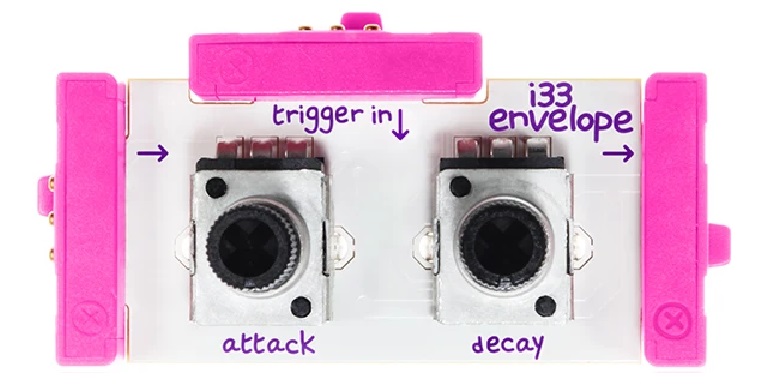
Another possible work-around is to follow the littleBits Oscillator with an Envelope module and connect the Envelope’s trigger to the Keystep Gate output through a littleBits CV module. [Whew!] The Envelope should pass and shut off the Oscillator’s sound when the gate is asserted and dropped, respectively. I’m going to give this idea a go.
Copyright © 2020 Paul J. Drongowski