
% Positive New Cases Per Day
It’s time to show some numbers of my own!
Thanks to The Seattle Times and the Washington State Department of Health (DOH), I have built a table that summarizes COVID-19 case statistics since late February. Data before March 10 is somewhat spotty and lacks the number of tests per day, etc. The raw numbers are shown in the table below.
            Cum      Cum    Cum
Date   Positive Negative   Tests New Cases New Tests Ratio  Notes
------ -------- -------- ------- --------- --------- -----  --------
Feb 28        1
Feb 29        7
Mar 2        18
Mar 4        39                                            SnoEmerg
Mar 5        70                                            Pence
Mar 6        83
Mar 7       102
Mar 8       136
Mar 9       162     1149    1311
Mar 10      267                        105
Mar 11      366     3037    3403        99                  Ban>250
Mar 12      457     4350    4807        91     1404  6.48%
Mar 13      568     6001    6569       111     1762  6.30%
Mar 14      643     7122    7765        75     1196  6.27%
Mar 15      769     9451   10220       126     2455  5.13%
Mar 16      904    11582   12486       135     2266  5.96%  HomeRec
Mar 17     1012    13117   14129       108     1643  6.57%
Mar 18     1187    15918   17105       175     2976  5.88%
Mar 19     1376    19336   20712       189     3607  5.24%
Mar 20     1524    21719   23243       148     2531  5.85%
Mar 21     1793    25328   27121       269     3878  6.94%
Mar 22     1996    28879   30875       203     3754  5.41%  Everett
Mar 23     2221    31712   33933       225     3058  7.36%
Mar 24     2469                        248                  StayHome
Mar 25     2580                        111
Mar 26     3207    43173   46380       627    12447  7.92%
Mar 27     3700    49015   52715       493     6335  7.78%
Mar 28     4300    54896   59196       600     6481  9.26%
Mar 29     4896    60566   65462       596     6266  9.51%
Mar 30     5515                                             DOHIssues
Mar 31     5984    68814   74798      1088     9336 11.65%
Apr 1      6585    72833   79418       601     4620 13.01%
Apr 2      6966    75633   82599       381     3181 11.98%
Apr 3      7591    80327   87918       625     5319 11.75%
Apr 4      7984                        393                  DOHIssues
Apr 5      8384                        400
Apr 6      8682                        298
Apr 7      9097                        415
Apr 8      9609                        512
Apr 9      9887                        278
Apr 10     10224                       337
Apr 11     10411                       187
Apr 12     10538                       127
Apr 13     10694   112160  122854      166
Apr 14     10783   113500  124283       89    1429   6.23%
Apr 15     11152   117748  128900      369    4617   7.99%
Apr 16     11445   120182  131627      293    2727  10.74%
Apr 17     11802           135706      357    4079   8.75%
Apr 18     11790   126852  138642             2936          DOHCorrection
Apr 19     12085   128926  141011      295    2369  12.45%
Apr 20     12282   132749  145031      197    4020   4.90%
Apr 21     12494   135459  147953      212    2922   7.26%
Apr 22     12753   140623  153376      259    5423   4.78%
Apr 23     12977   147347  160324      224    6948   3.22%
Apr 24     13319   157275  170594      342   10270   3.33%
Apr 25     13521   161956  175477      202    4883   4.14%
Apr 26     13686   165993  179679      165    4202   3.93%
Apr 27     13842   168673  182515      156    2836   5.50%
Apr 28     14070   173730  187800      228    5285   4.31%
Apr 29     14327   179654  193981      257    6181   4.16%
Apr 30     14637   184087  198724      310    4743   6.54%
May 1      15003   192312  207315      366    8591   4.26%
May 2      15185   196820  212005      182    4690   3.88%
May 3      15462   200858  216320      277    4315   6.42%
May 4      15594   203859  219453      132    3133   4.21%
May 5      15905   208908  224813      311    5360   5.80%
May 6      16231   214449  230680      326    5867   5.56%
May 7      16388   219447  235835      157    5155   3.05%
May 8      16674   226315  242989      286    7154   4.00%
May 9      16891   231984  248875      307    5886   5.22%
May 9      16891   231984  248875      307    5886   5.22%
May 10     17122   234986  252108      231    3233   7.15%
May 11     17330   238991  256321      208    4213   4.94%
May 12     17512   243568  261080      182    4759   3.82%
May 13     17773   250158  267931      261    6851   3.81%
May 14     17951   255352  273303      178    5372   3.31%
May 15     18288   262705  280993      337    7690   4.38%
May 16     18433   266810  285243      145    4250   3.41%
May 17     18611   270524  289135      178    3892   4.57%
May 18     18811   274309  293120      200    3985   5.02%
May 19     18971   278971  297942      160    4822   3.32%
May 20     19117   283810  302927      146    4985   2.93%
May 21     19265   289093  308358      148    5431   2.73%
May 22     19585   296691  316276      320    7918   4.04%
May 23     19828   306765  326593      243   10317   2.36%
May 24     20065   310533  330598      237    4005   5.92%
May 25     20181   312610  332791      116    2193   5.29%  George Floyd
May 26     20406   315395  335801      225    3010   7.48%
May 27     20764   322327  343091      358    7290   4.91%
May 28     21071   327162  348233      307    5142   5.97%
May 29     21349   333005  354354      278    6121   4.54%  SEA protests
May 30     21702   339197  360899      353    6545   5.39%
May 31     21977   343295  365272      275    4373   6.29%
Jun 1      22157   346642  368799      180    3527   5.10%
Jun 2      22484   354843  377327      327    8528   3.83%
Jun 3      22729   360858  383587      245    6260   3.91%
Jun 4      22993   367870  390863      264    7276   3.63%
Jun 5      23442   377146  400588      449    9725   4.62%
Jun 6      23729   381327  405056      287    4468   6.42%
Jun 7      24041   386249  410290      312    5234   5.96%
Jun 8      24354   390700  415054      313    4764   6.57%
Jun 9      24642      ---     ---      288     ---    ---
Jun 10     24779   400433  425212      137   10158   4.18%
Jun 11     25171   414691  439862      392   14550   2.69%
Jun 12     25538   424608  450146      367   10284   3.57%
Jun 13     25834   436768  462602      296   12456   2.38%
Jun 14     26158   445107  471265      324    8663   3.74%
Jun 15     26531   453495  480026      373    8761   4.26%
Jun 16     26784   408232  435016      253     ---     ---  DOH no sero
Jun 17     27192   419707  446899      408   11883   3.43%
Jun 18     27601   428340  455941      409    9042   4.52%
Jun 19     28225   437844  466069      624   10128   6.16%
Jun 20     28680   446258  474938      455    8869   5.13%
Jun 21     28870   448334  477204      190    2266   8.38%
Jun 22     29386   457673  487059      516    9855   5.24%
Jun 23     29869   465629  495498      483    8439   5.72%
Jun 24     30367   475428  505795      498   10297   4.84%
Jun 25     30855   483573  514428      488    8633   5.65%
Jun 26     31404   494398  525802      549   11374   4.83%
Jun 27     31752   502691  534443      348    8641   4.03%
Jun 28     32253   515967  548220      501   13777   3.64%
Jun 29     32824   524451  557275      571    9055   6.31%
Jun 30     33435   538529  571964      611   14689   4.16%
Jul 1      34151   550838  584989      716   13025   5.50%
Jul 2      34778   565197  599975      627   14986   4.18%
Jul 3      35247   572029  607276      469    7301   6.42%
Jul 4      35898   576808  612706      651    5430  11.99%
Jul 5      36985   592271  629256     1087   16550   6.57%
Jul 6      37420   598104  635524      435    6268   6.94%
Jul 7      37941   607131  645072      521    9548   5.46%
Jul 8      38581   621749  660330      640   15258   4.19%
Jul 9      39218   629248  668466      637    8136   7.83%
Jul 10       ---
Jul 11     40656   645349  686005     1438   17539   8.20%
Jul 12     41757   666517  708274     1101   22269   4.94%
Jul 13     42304   675930  718234      547    9960   5.49%
Jul 14     43046   690840  733886      742   15652   4.74%
Jul 15     44313   708861  753174     1267   19288   6.57%  Yakima backlog
Jul 16     45067   722590  767657      754   14483   5.21%
Jul 17     46026   745760  791786      959   24129   3.97%
Jul 18     46946   762393  809339      920   17553   5.24%
Jul 19     47743   778611  826354      797   17015   4.68%
Jul 20     48575   792609  841184      832   14830   5.51%
Jul 21     49247   805905  855152      672   13968   4.81%
Jul 22     50009   820754  870763      762   15611   4.88%
Jul 23     50824   833158  883982      815   13219   6.17%
Jul 24     51849   851825  903674     1025   19692   5.21%
Jul 25     52635   866712  919347      786   15673   5.01%
Jul 26     53321   879983  933304      686   13957   4.92%
Jul 27     54205   891029  945234      884   11930   7.41%
Jul 28     54985   903322  958307      780   13073   5.97%
Jul 29     55803   917851  973654      818   15347   5.33%
Jul 30       ---                                             DOH outage
Jul 31     57541   943987 1001528     1738   27874   6.24%
Aug 1      58173   950107 1008280      632    6752   9.36%
Aug 2      58715      ---              542                   DOH issues
Aug 3      59379      ---              664
Aug 4      60084      ---              705
Aug 5      60917      ---              833
I have tried to make this table as accurate as possible. Please forgive any transcription errors. The Washington Department of Health has suffered technical issues, so there are gaps in the data. Their database has been overwhelmed and they have had trouble tallying negative test results and the number of tests.
Don’t forget about the University of Washington Virology Laboratory COVID-19 dashboard as another reliable data source.
The State DOH reports the cumulative number of positive cases (tests) negative test results daily — the second and third columns in the table. The fourth columb, cumulative number of tests, is the sum of the cumulative positive and negative results each day.
From these numbers, we can compute the number of new positive cases and the number of new tests for each 24 hour period:
    Tests.Today = Positive.Today + Negative.Today
    New cases = Positive.Today - Positive.Yesterday
    New tests = Tests.Today - Tests.Yesterday
    Ratio = (New cases / New Tests) * 100.0
The seventh column, ratio, is the percentage of positive new cases per day. I believe that this percentage is an appropriate measure for tracking COVID-19 over time. The ratio normalizes the number of positive cases for the number of tests performed. Thus, it makes daily results comparable even as our test capacity and number of daily tests grow.
Update: Washington State calls this ratio/percentage “Positivity Rate.”
The bar chart below is a quick and dirty plot of the daily percentage of positive cases over the last ten days. Be sure to check the vertical scale when interpreting the chart!
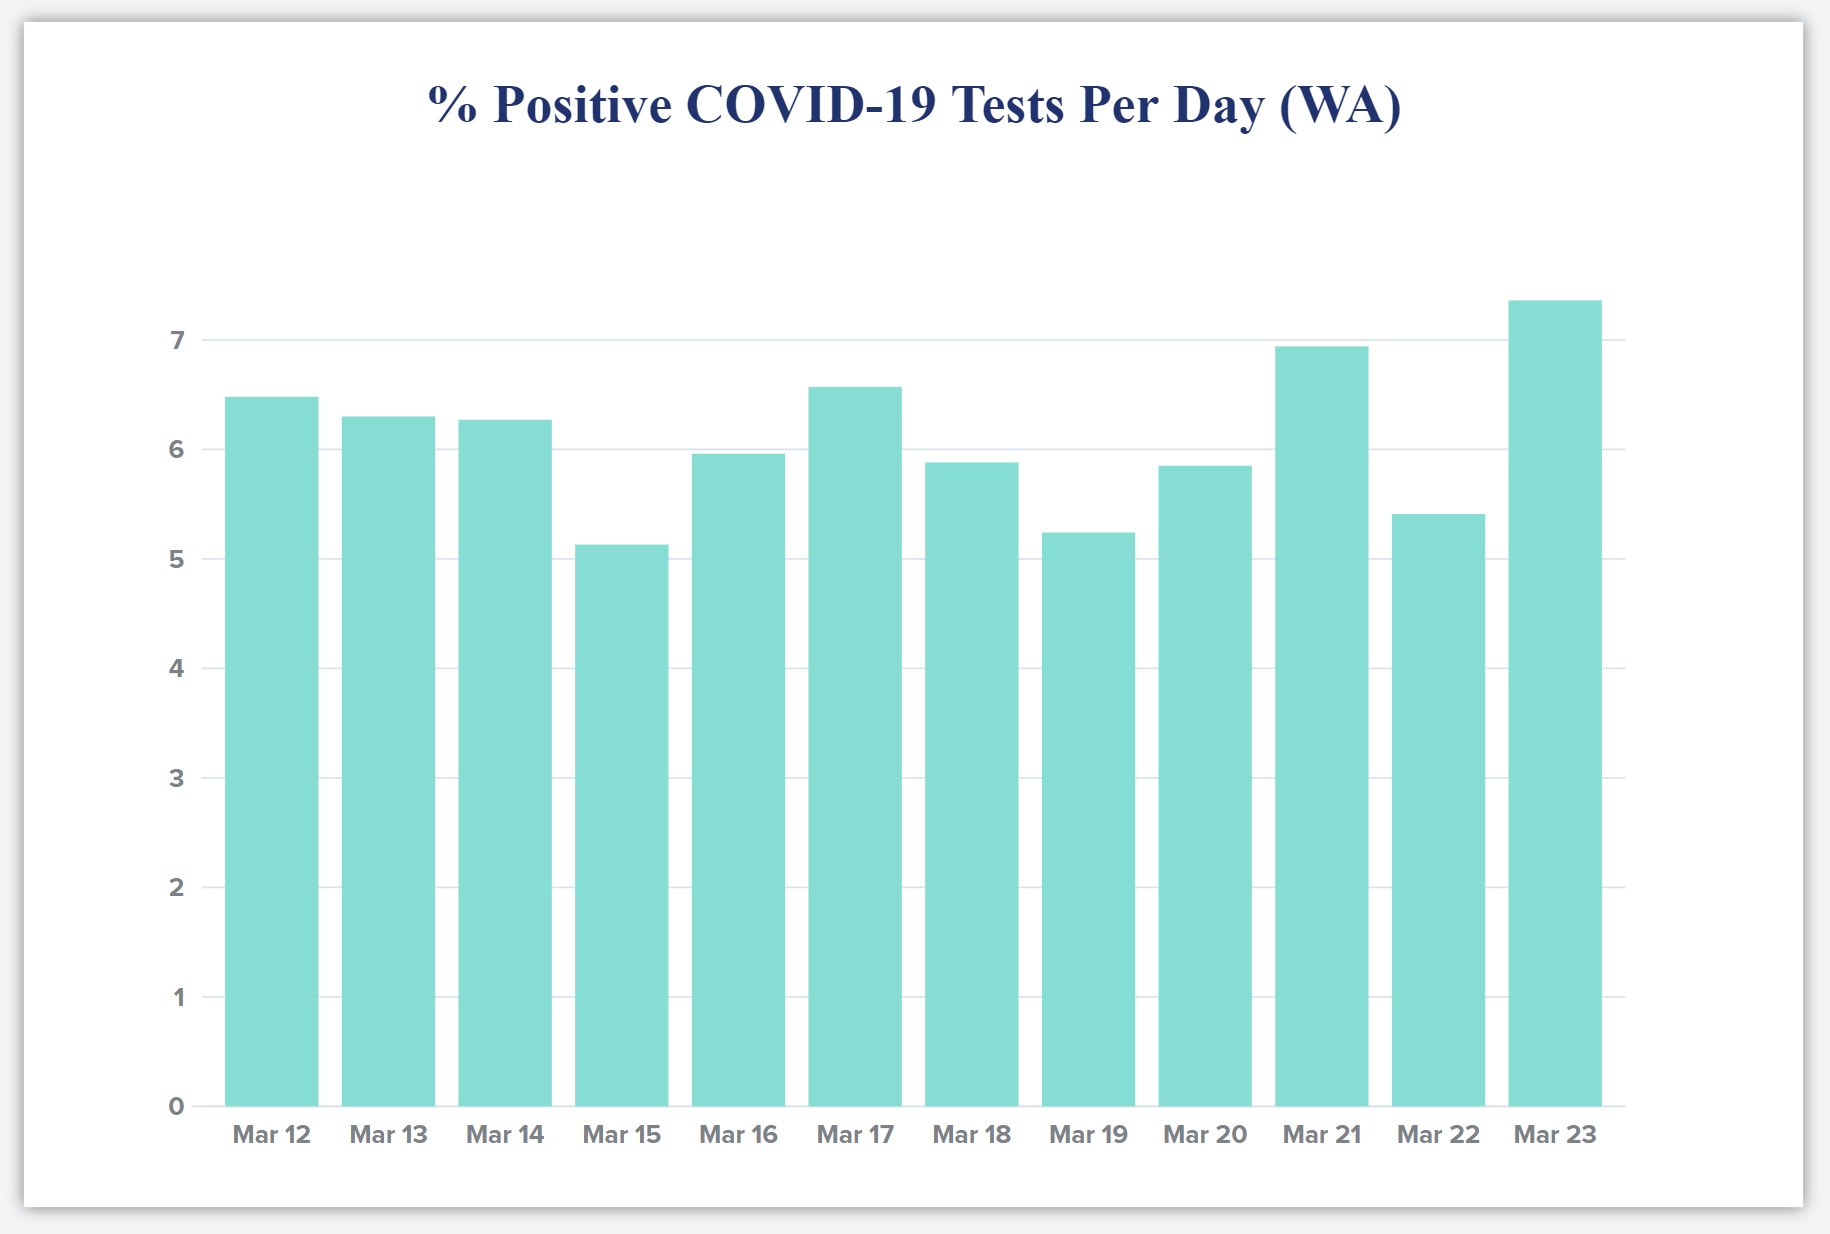
I hope this trend declines. Please remember that any measurements taken today show what COVID-19 was doing 10 to 14 days ago. The delay is due to the time required for COVID-19 incubation, worsening of symptoms, clinical presentation and testing.
The last column in the table, Notes, are my mental notes marking significant events along the COVID-19 timeline in our area. The events are:
- Snohomish County (my home) declares a state of emergency.
- Vice President Pence visits the State of Washington.
- Governor Inslee bans groups of more than 250 people.
- The State advises people to stay at home, especially the elderly.
- The City of Everett (a stone’s throw away from home) imposes a stay at home order.
Up to today, Governor Inslee has not imposed a blanket “stay at home” order. Suggestions made by the state are similar to a stay at home order, but do not have the force of law.
Don’t do this
Here is the egregious chart of the day by way of Cleveland.com. I still check in with my original hometown. Hope the Cavs can hit the court again.
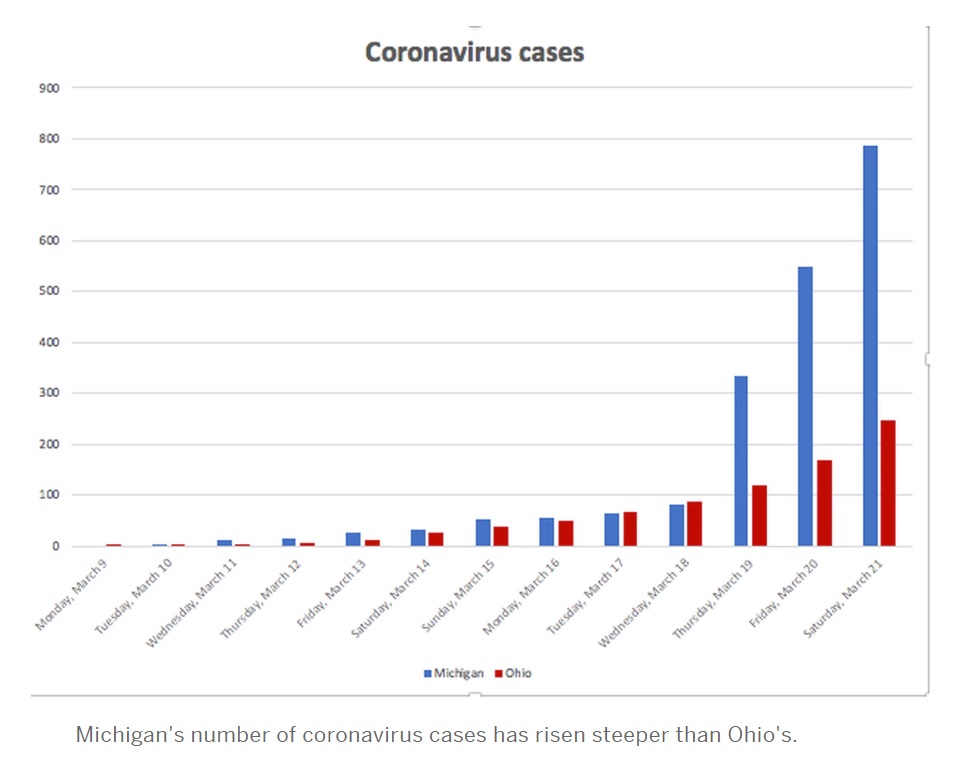
To be fair, the author did put a few caveats about number of tests, etc. in the article. The caveats are lost in the TL:DR age. Please don’t publish meaningless charts and comparisons.
If I were teaching a math or science class today, I think I would use this chart in class about critical thinking and interpetation of the graphs thrown at us by the media.
No one (CNN, etc.) should compare state-by-state number at this point in time. There isn’t a standard for reporting and test capacity is, literally, all over the map.
Stay distant and stay healthy — pj