
Epidemiologic testing
Yesterday, CNN carried interviews with Dr. Anthony Fauci and Bill Gates. Both gentlemen called for community-wide epidemiological studies of COVID-19. We need to know the prevelance of the disease in our communities in order to assess the effectiveness of community mitigation (i.e., social distancing).
Broadly speaking, there are two kinds of COVID-19 testing:
- Diagnostic testing
- Epidemiologic testing
Diagnostic testing is patient-focused. It determines if the tested individual is infected with SARS-CoV-2 (the virus which causes disease COVID-19) in order to isolate and treat the patient. Due to limited test capacity, all testing to date is diagnostic in purpose.
There are variants of diagnostic testing on the horizon such as a test to determine if an individual has acquired immunity to COVID-19 or not (antibody testing).
Epidemiologic testing is like a political poll. People are selected at random from the community, statistically called the “population.” The selected people are tested for SARS-CoV-2 infection using the same kind of medical test employed in diagnostic testing. Personal information is also collected such as age, sex, presence of underlying medical conditions, previous COVID-19 diagnosis, and so forth. Statistics are tallied and summarized such as the percentage infected, susceptible (not yet infected) and immunity. Like a political poll, the statistics are broken out by age, sex and so forth.
We have not yet performed a single community-wide epidemiological study of COVID-19. This leaves us blind to one important segment in the community — people in the community who are infected and are asymptomatic. We know that asymptomatic people are a significant factor in the spread of SARS-CoV-2 and COVID-19.
Impatient people are already chomping at the bit to restart the American economy. Given that we are only 2 weeks (at best) into community mitigation, this is preposterous. [Some communities have not even started social distancing and they are late.] At some point, though, we must restart the economy. Epidemiological studies will help us to decide if it is safe to reduce community mitigation and allow the free flow of commerce again.
One important factor in the decision to reduce mitigration is the degree of immunity in the community, the so-called “herd immunity.” The community (the herd) becomes protected from a disease when a large portion of the population (typically, 60%) is immune to infection. Infected individuals often become immune when they successfully fight off and recover from the disease (acquired immunity). Better yet, individuals can be made immune through vaccination.
Acquired COVID-19 immunity has not been confirmed by scientific study at this time. Based on prior experience with other coronaviruses, medical experts believe that recovered individuals will be immune to SARS-CoV-2.
“Flattening the curve” has two benefits. First, it reduces the strain on the health care system (hospitals, doctors, nurses and other caregivers). Second, it buys us the necessary time to develop a safe vaccine and to get a vaccination program ramped up and put in place. In some sense, developing the vaccine is the easy part. The time-consuming part is the medical trials and studies needed to assume safety and efficacy.
The Seattle Flu Study
During the Bill Gates interview, he mentioned The Seattle Flu Study.
The Seattle Flu Study was initially started to detect, monitor and control influenza outbreaks in Seattle using rapid virus genetic sequencing and mapping chains of transmission. The study is led by the Brotman Baty Institute, in collaboration with UW Medicine, The Fred Hutchinson Cancer Research Center, and Seattle Children’s.
With the outbreak of COVID-19, the Seattle Flu Study was “repurposed” to COVID-19. Quoting:
We are partnering with Public Health — Seattle & King County to launch the greater Seattle Coronavirus Assessment Network — or SCAN for short.
To track the spread of COVID-19, SCAN will collect nasal swabs from a sample of people across Seattle and King County, working to mirror the area’s population as closely as possible. We’ll collect swabs from both those who are healthy and those who feel sick and will also test de-identified clinical residual samples (these are left-over samples from tests performed for other reasons at clinical laboratories). The results of these tests will help us understand the outbreak more completely and, along with other data sources, help inform public health decisions. SCAN is not able to offer testing to every individual but the whole community will benefit from the program.
I look forward to the results of the SCAN study since we live a stone’s throw away from King County, Washington. This is our ‘hood.
Logarithmic graphs
Logarithmic graphs are good tools when analyzing phenomena with exponential growth. At this point, we’ve all seen linear scale graphs showing the steep rise of COVID-19 cases. Each tick in a linear scale graph has the same statistical weight, e.g., 100, 200, 300, 400, etc.
A logarithmic graph has a logarithmic scale. Each tick increases by a power of 10, e.g., 100, 1,000, 10,000, 100,000, etc. An exponential trend appears as a straight line in a logarithmic graph. Here is a logarithmic graph (from The Guardian, March 27).
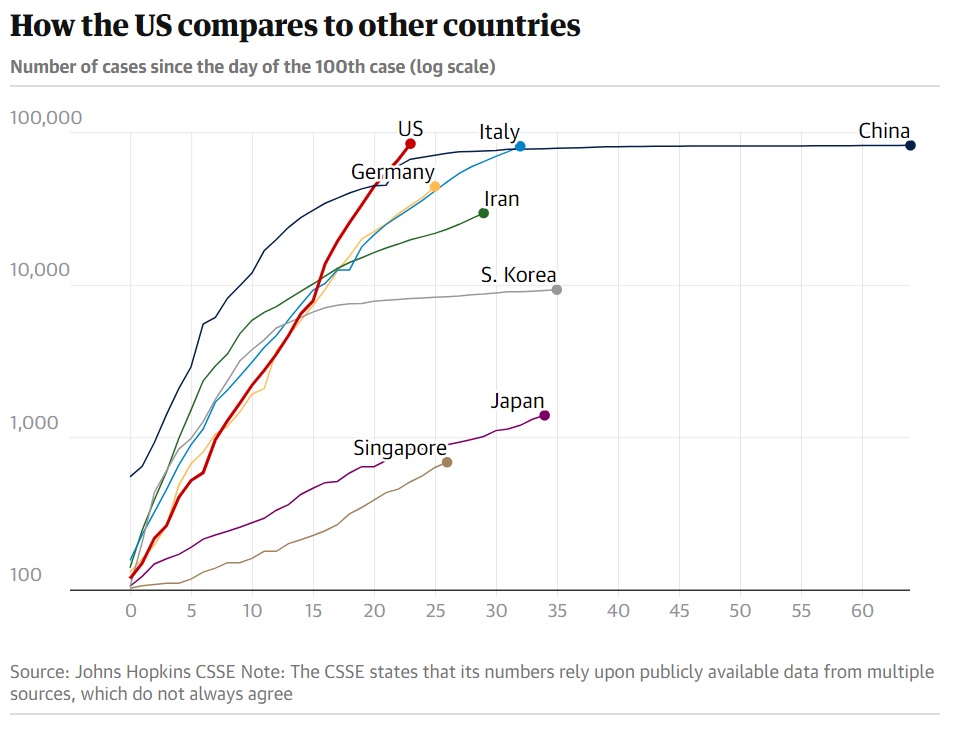
Sadly, the United States is on an exponential trajectory. China and South Korea, in particular, have asymptotic curves, showing successul COVID-19 community mitigation. Those two countries are “flattening the curve.”
New York State Hospitalizations
Gov. Andrew Cuomo of New York presented an important and useful graph during his briefing this morning.
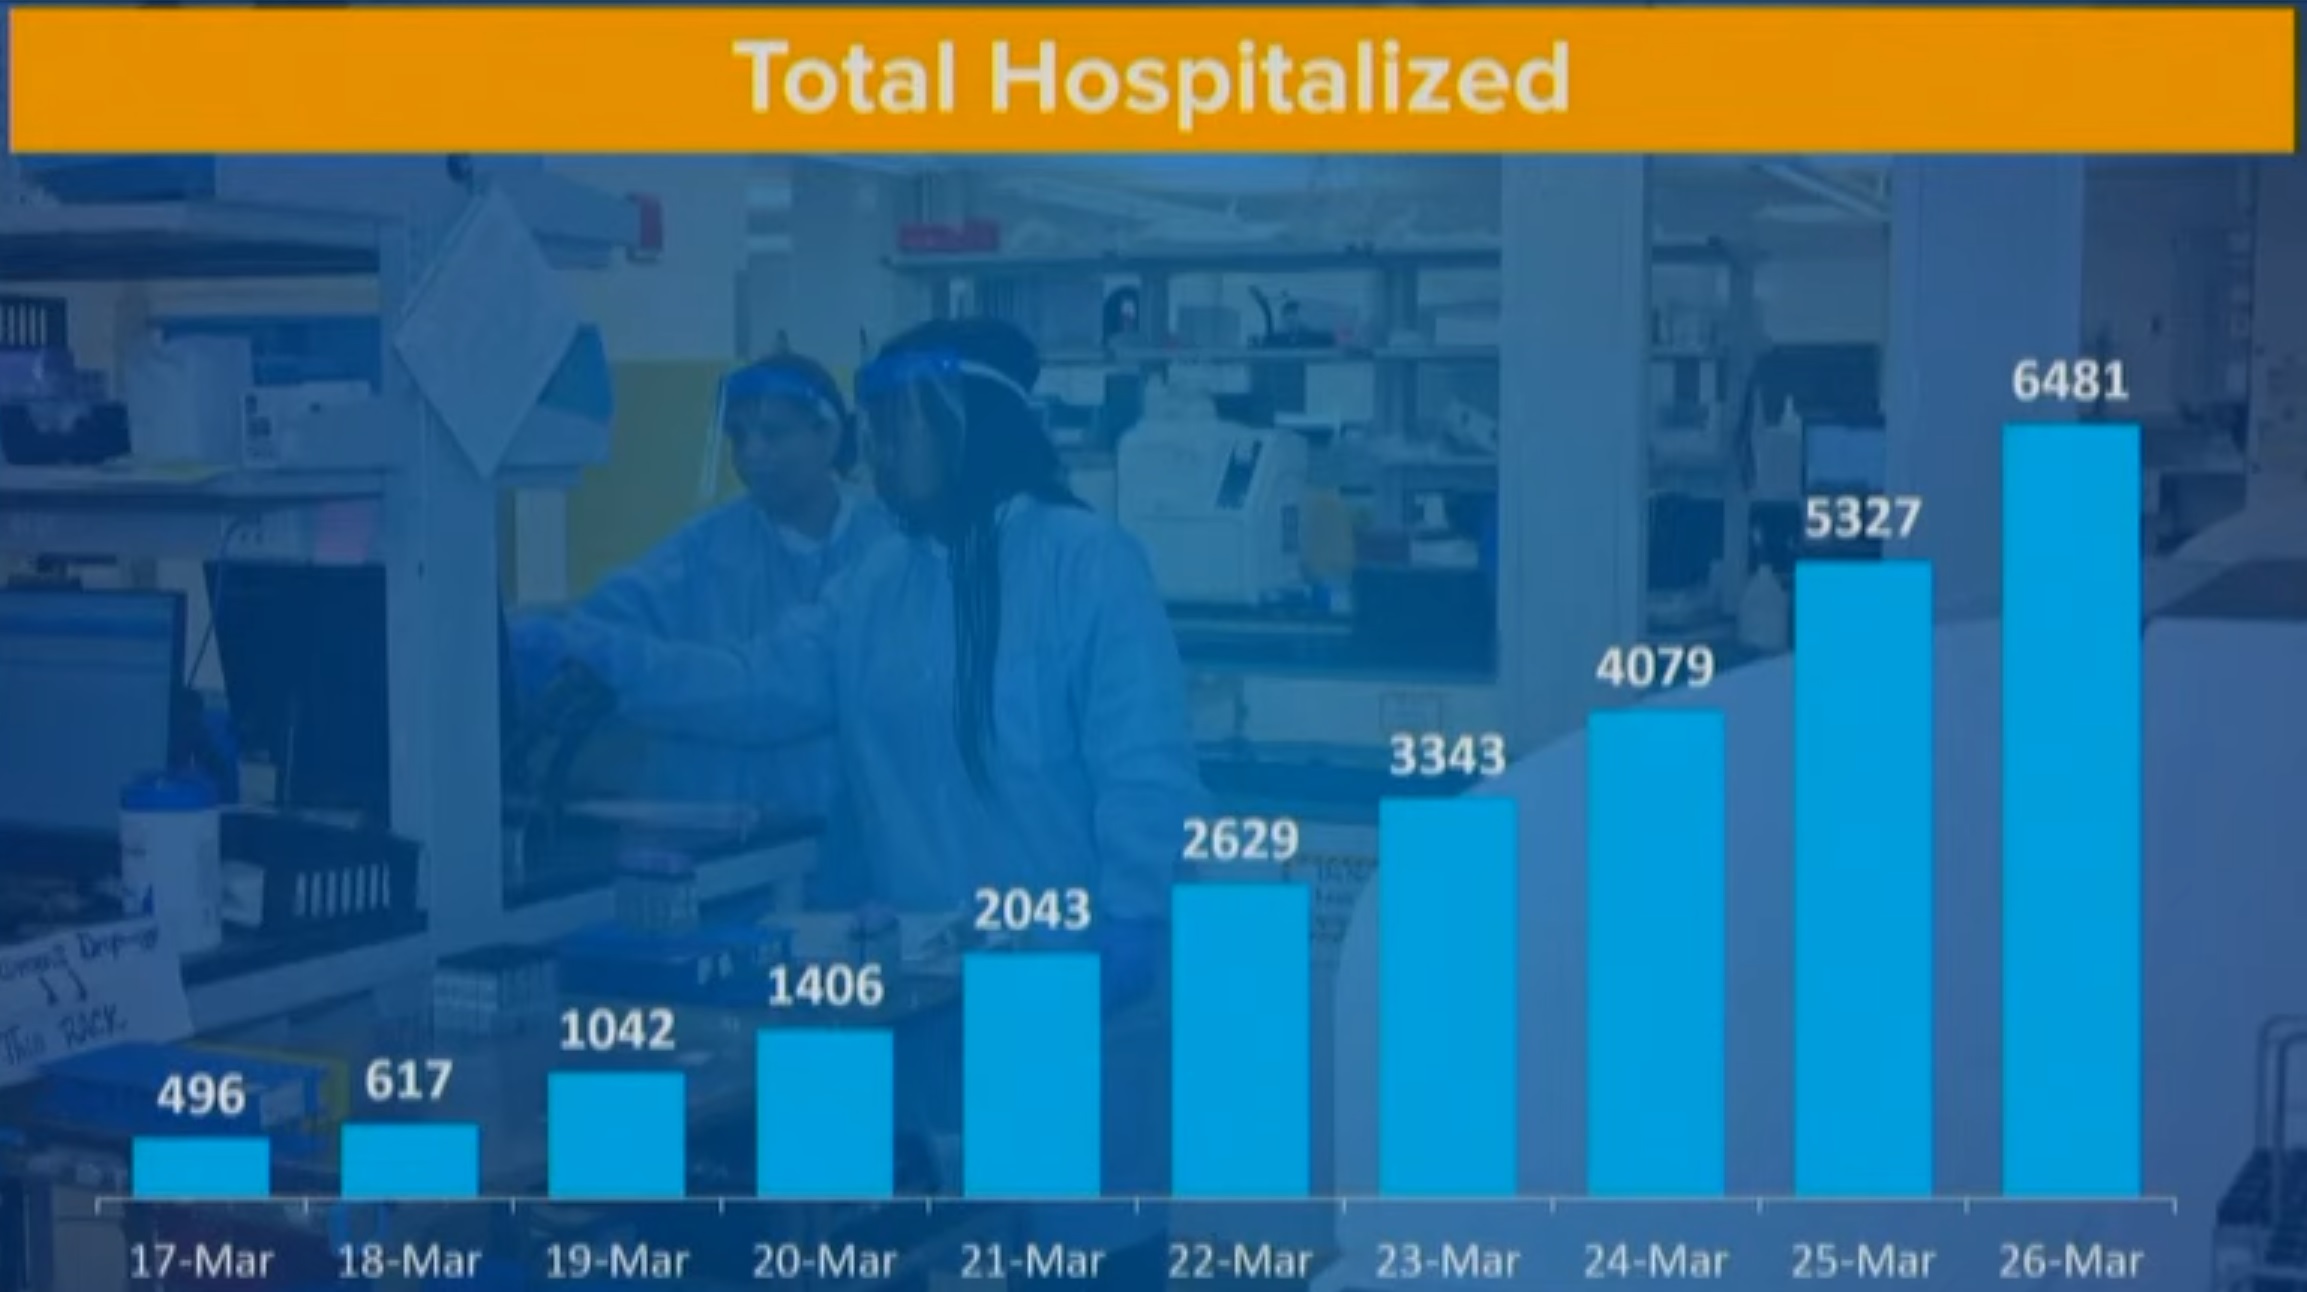
This chart shows the number of hospitalizations per day. Please note that the number of hospitalizations is increasing by almost 1,200 new patients per day. No health care system can sustain this kind of growth. New York State expects the apex of hospitalizations in 21 days, adding a further 25,200 hospitalized patients, if the current rate continues.