
As I mentioned earlier today, The New York Times staff has published some excellent maps, charts and interactive simulations.
Their latest interactive simulation illustrates the effect of community mitigation (i.e., social distancing) for varying periods of time. I took snapshots at weekly intervals (social distancing for 7 days, 14 days, 21 days, etc.) [Click to enlarge.]
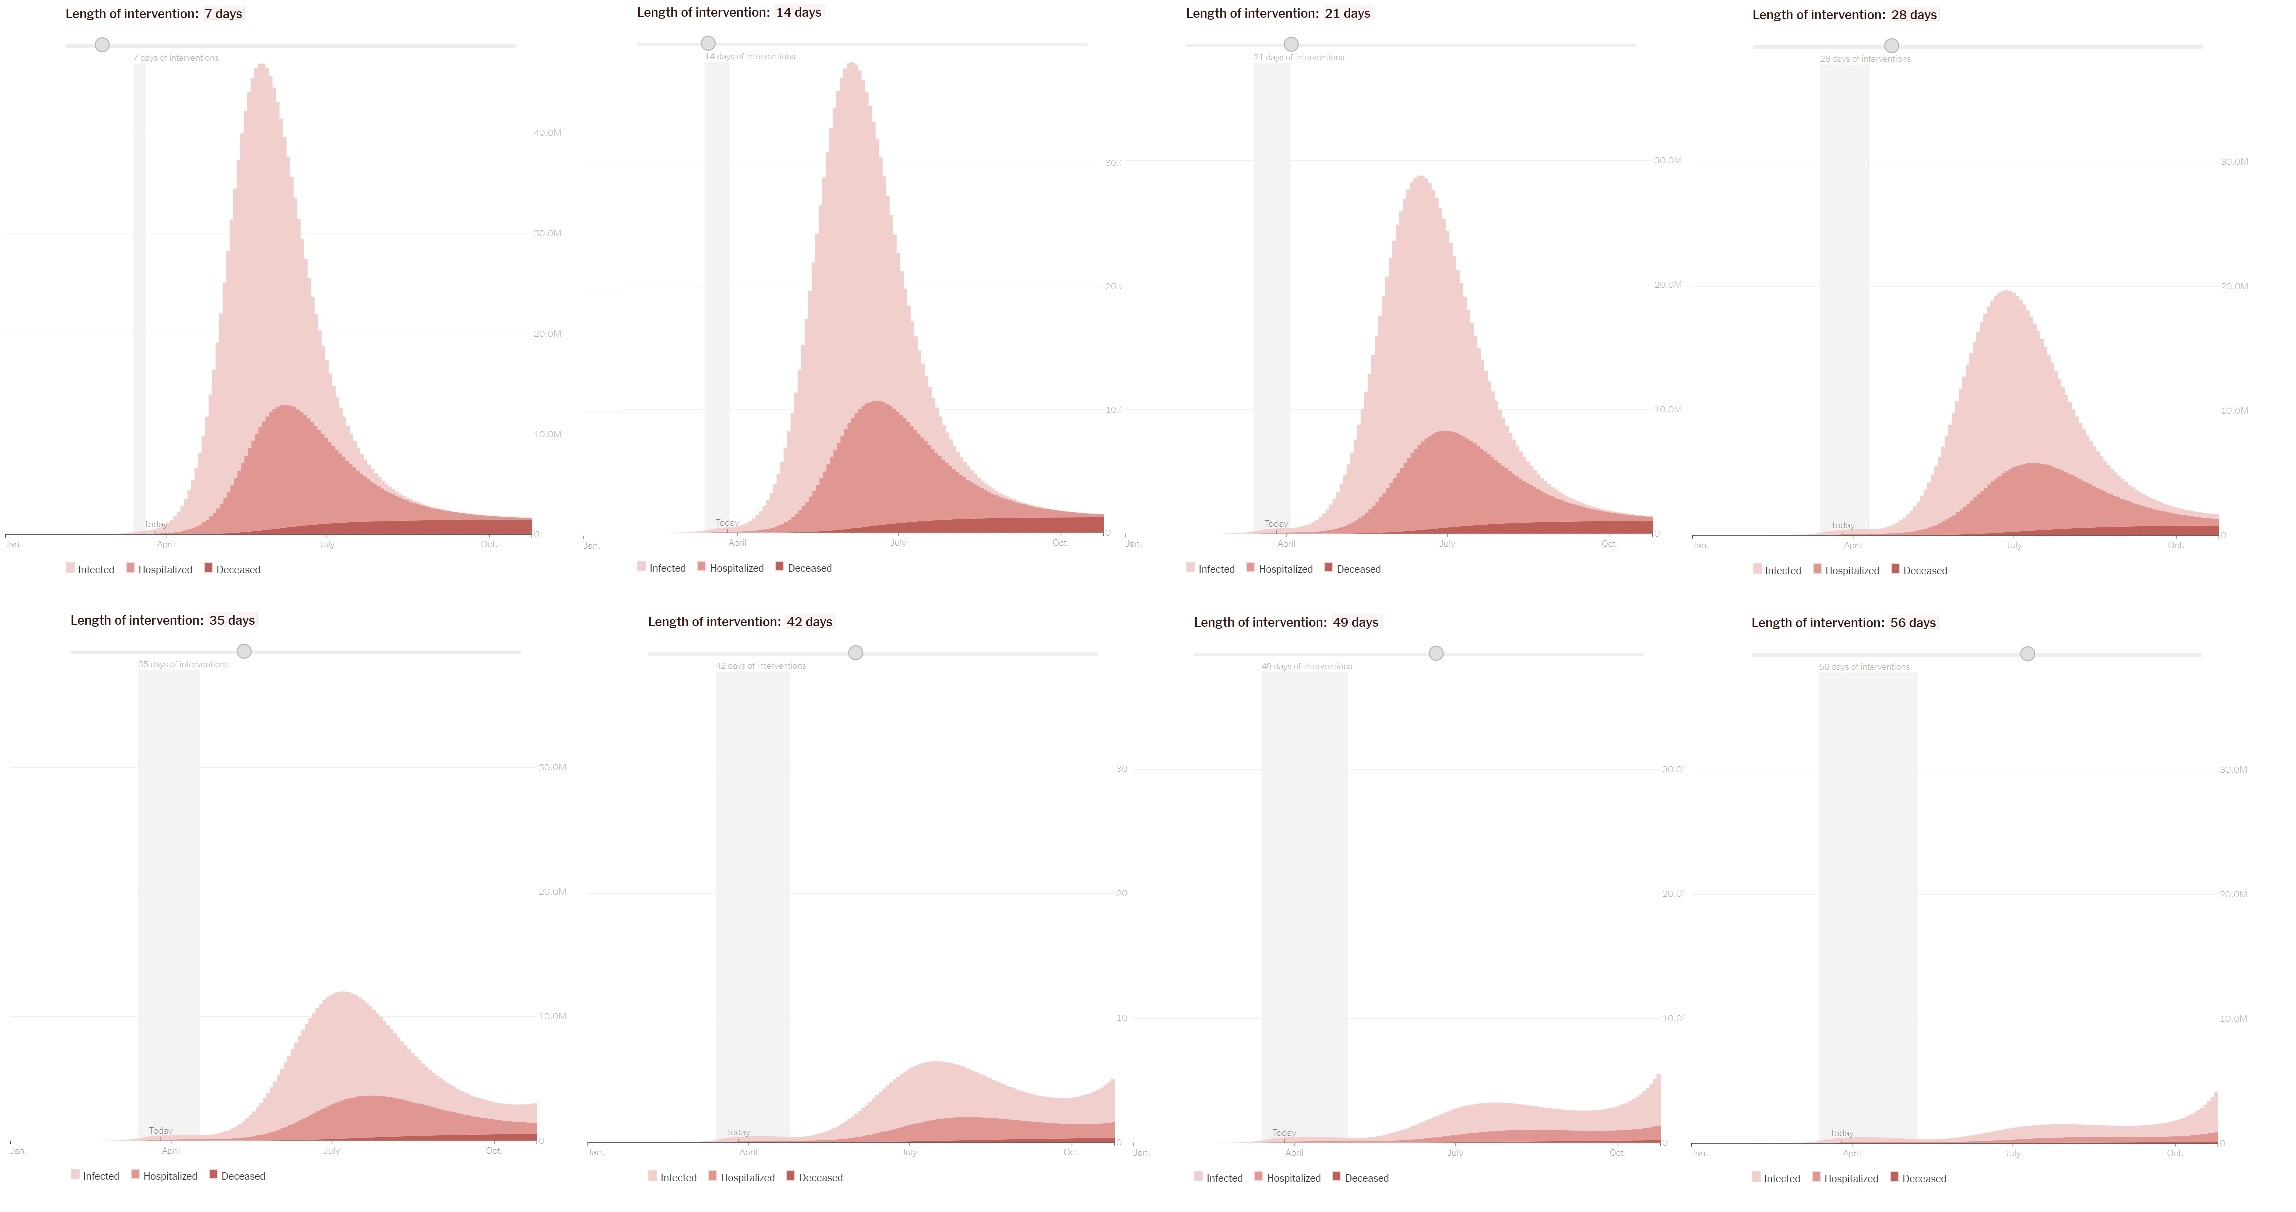
The curve in the lightest shade is the number of infected people. The middle shade curve is the number of people hospitalized and the darkest shade curve is the number of deaths. Each tick in the vertical scale is 10 million. Yes, millions. I recommend reading the article itself for assumptions and caveats on the mathematical model.
From this time series, it’s easy to see that two weeks (14 days) of community mitigation is wholly inadequate for suppressing the disease, let alone stopping it. To my eye, the shortest reasonable duration is 42 days (6 weeks).
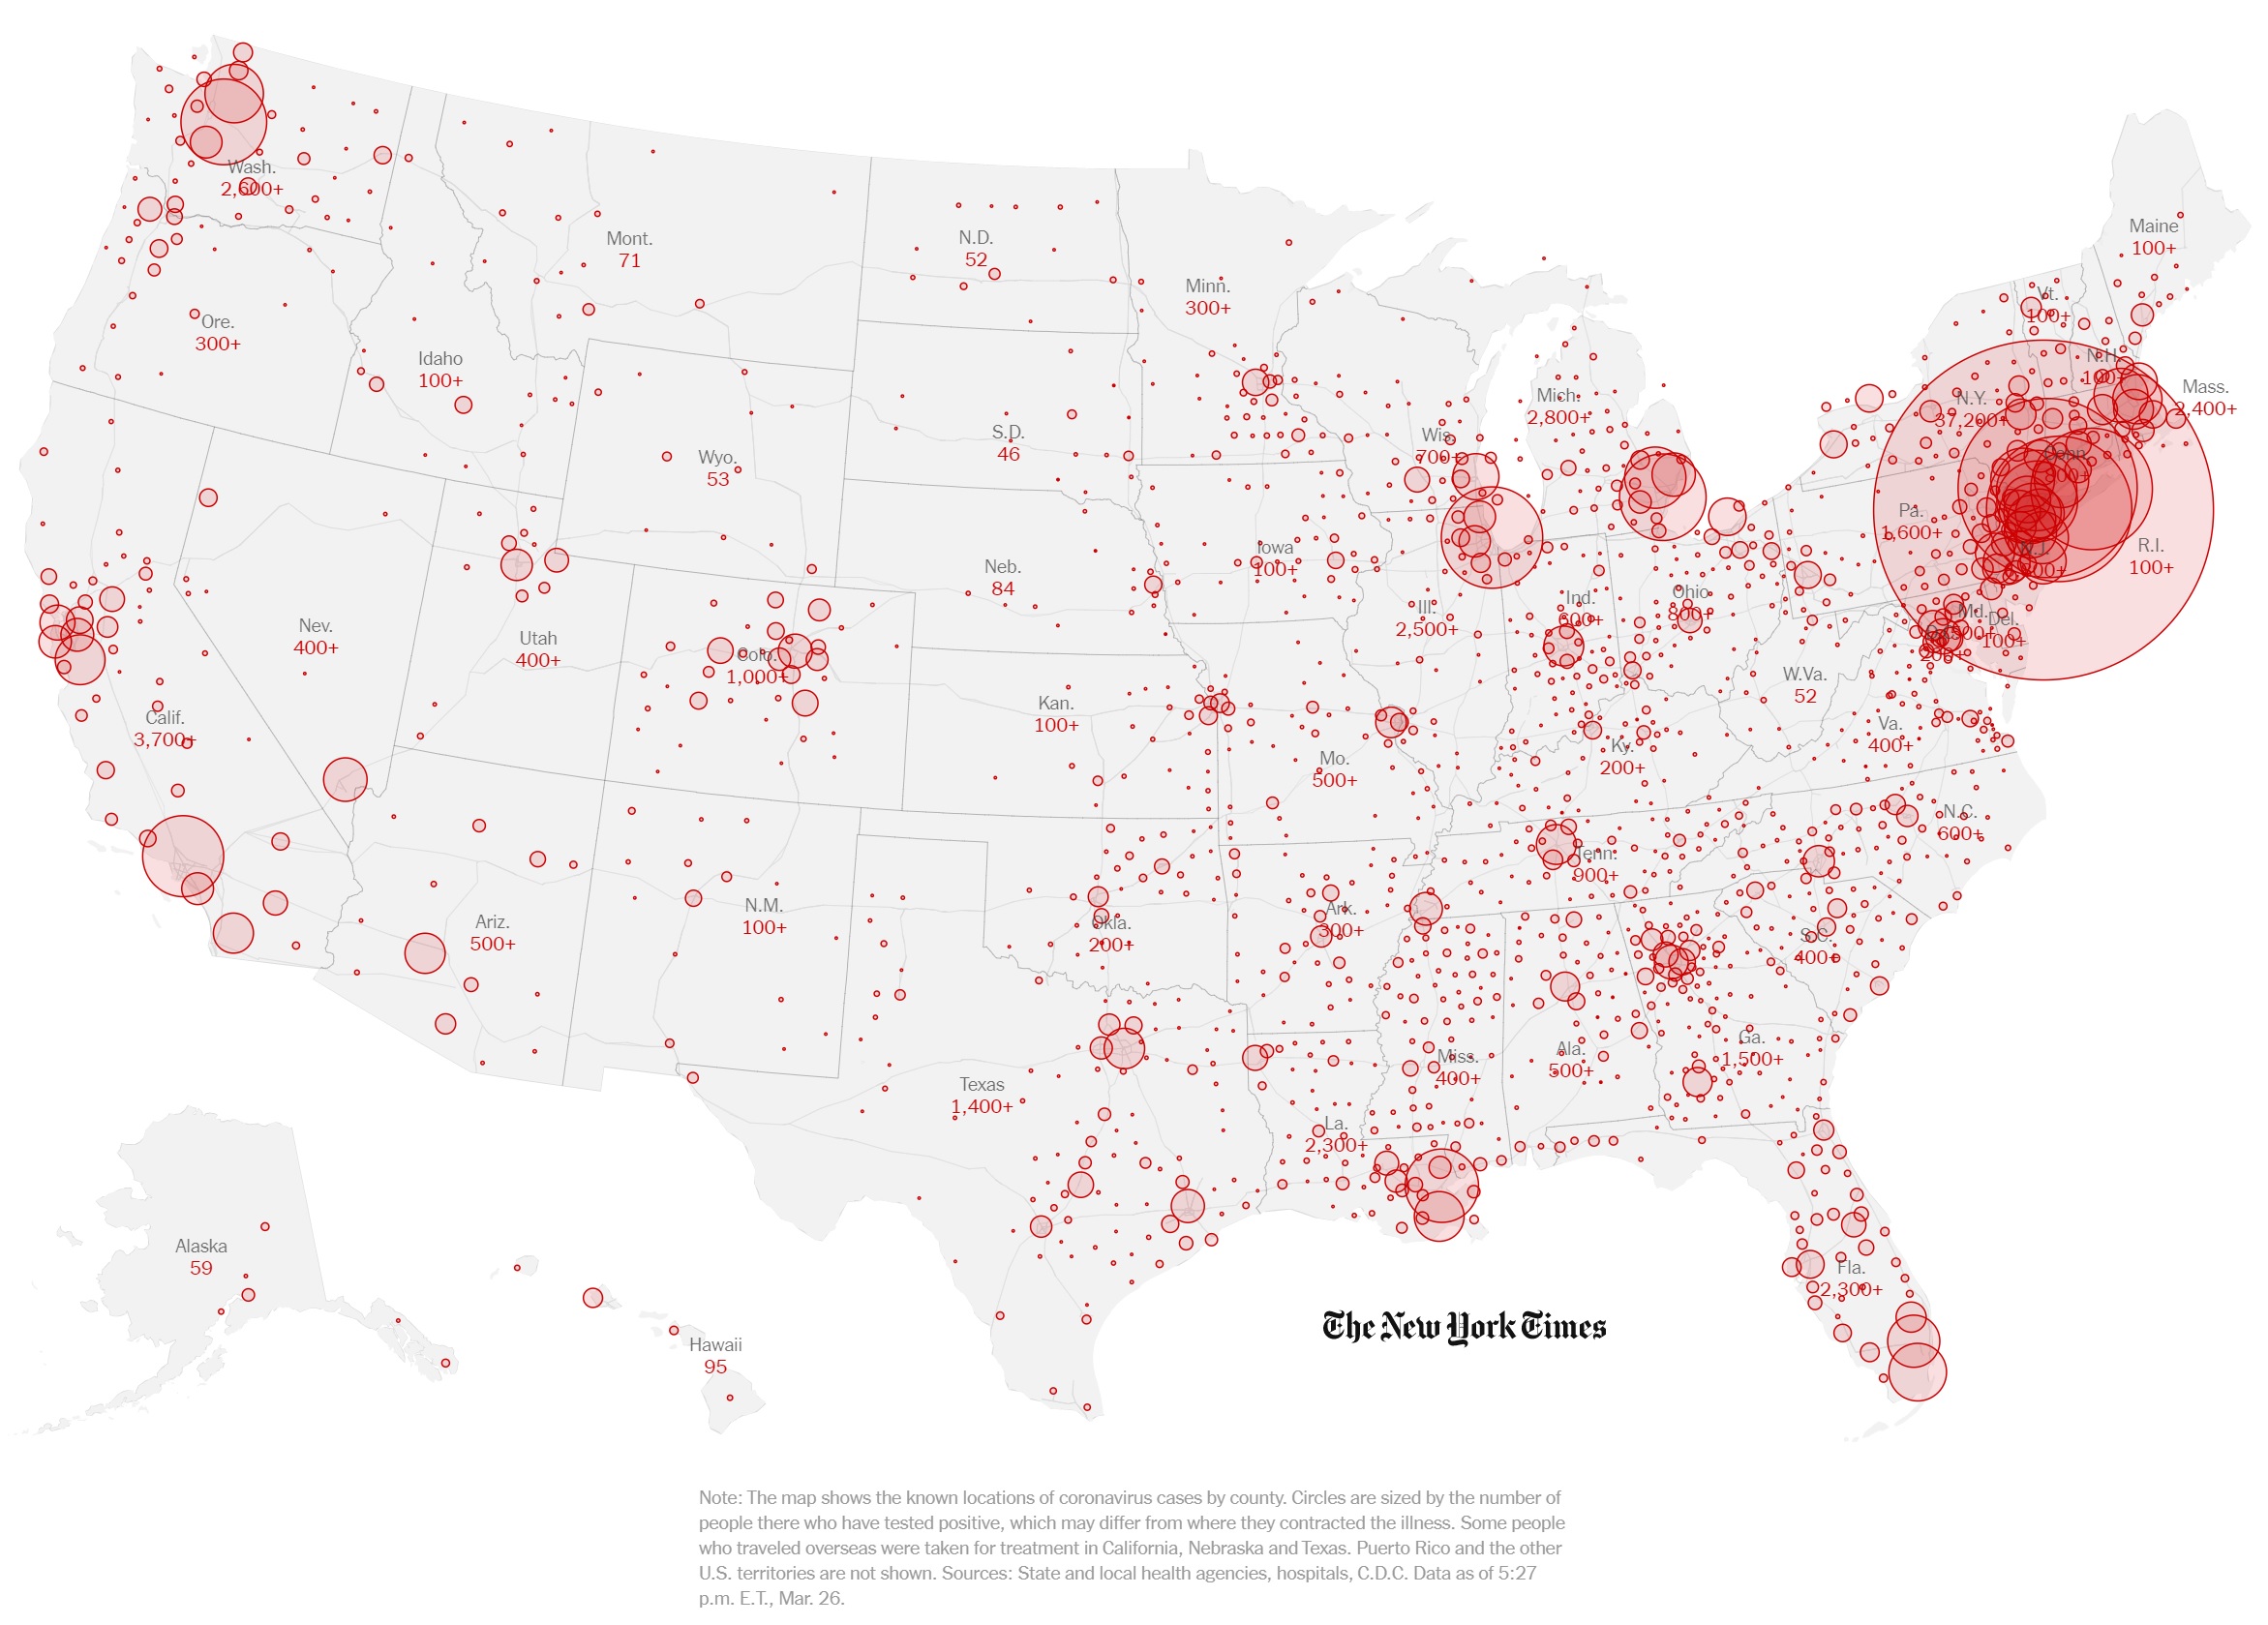
Here is the latest NYT map (March 26, 2020) depicting the spread of COVID-19 across the United States. [Click to enlarge.]
Dedicated to Edward Tufte, who is still kicking around, thank goodness.