
On March 16, President Trump warned that the COVID-19 outbreak could last until July or August 2020. This was the first official recognition that the outbreak could take months to quell, not a few weeks. On March 18, The New York Times and other media outlets published the U.S. Government COVID-19 Response Plan. The plan states that a moderately severe outbreak could last 12 to 18 months with multiple “waves.”
The duration and potential number of waves may shock some. However, the timing and waves of resurgence/subsidence are fairly typical for epidemics and other phenomena in nature. Consider, for example, predator-prey population models. Predators thrive and reproduce when prey are plentiful. When the food supply dwindles, predators die off and the predator population dwindles. With fewer predators, prey survive and multiply. The cycle of growth and decline repeats.
Viruses need susceptible, infectable hosts in order to reproduce. Thanks to bodily immunilogical response, human hosts may develop an immunity as a result of infection and recovery. Immunity may be limited to the specific infecting strain of the virus. Unfortunately, viruses are adaptable and a strain may mutate into a new different strain which is not suppressed by immunity to the original strain.
The specific behavior of SARS-CoV-2 — the virus which causes the disease COVID-10 — is not fully known, including human immunilogical response to SARS-CoV-2. Citing Dr. Anthony Fauci, no scientific study to date has demonstrated acquired immunity to SARS-CoV-2. Dr. Fauci and other experts believe that acquired immunity is likely.
Timeline
The U.S. Government COVID-19 Response Plan states, “Late December 2019, authorities from the People’s Republic of China (PRC) announced a possible epidemic of pneumonia of unknown etiology centralized on a local large seafood and live animal market in Wuhan, China. Estimated case onset was early December.”
Given the lack of Chinese transparency, slow governmental response and the speed/extent of modern jet travel, the SARS-CoV-2 virus has probably been circulating in Snohomish and King County Washington for quite some time. The report states, “The first U.S. case of COVID-19 was confirmed in Washington State on January 20 and was travel-related.” This patient landed from Wuhan, China on January 15 without symptoms and eventually presented on January 19 with symptoms of pneumonia.
The first case of community spread in the U.S. (California) was confirmed by the CDC on February 26, 2020. The first case of community spread in Snohomish County, WA was confirmed on February 28. Thus, SARS-CoV-2 circulated in the Snohomish and King County area for nearly six weeks. Detection of community spread is a red flag for a developing epidemic.
On March 9, the Washington Department of Health confirmed 162 total cases including 22 deaths. Most of these deaths occurred at Life Care Center of Kirkland, a nursing home linked to at least 54 confirmed cases as of March 9. King and Snohomish Counties had 116 and 37 total cases, respectively, as of March 9. If you are interested in the details, the March 18, 2020 CDC MMWR is short and to the point.
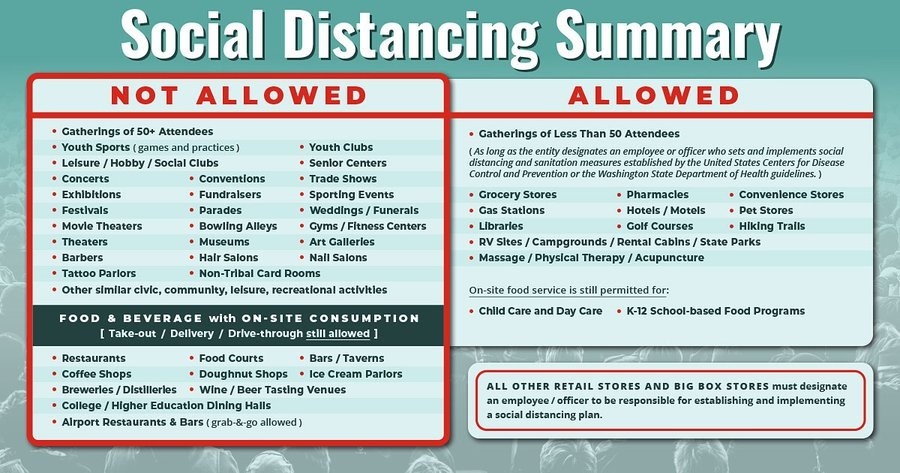
Washington State immediately announced and slowly ramped up community mitigation. Governor Inslee issued the most stringent order on March 16. As of today, March 20, the state government has not issued a “stay/shelter at home” order like California.
Washington’s new cases
The timeline is important in understanding current new case data and in knowing what to look for in the coming two to three weeks.
The University of Washington Virology Laboratory published a graph of its testing results as of Friday, March 20, 2020 (below).
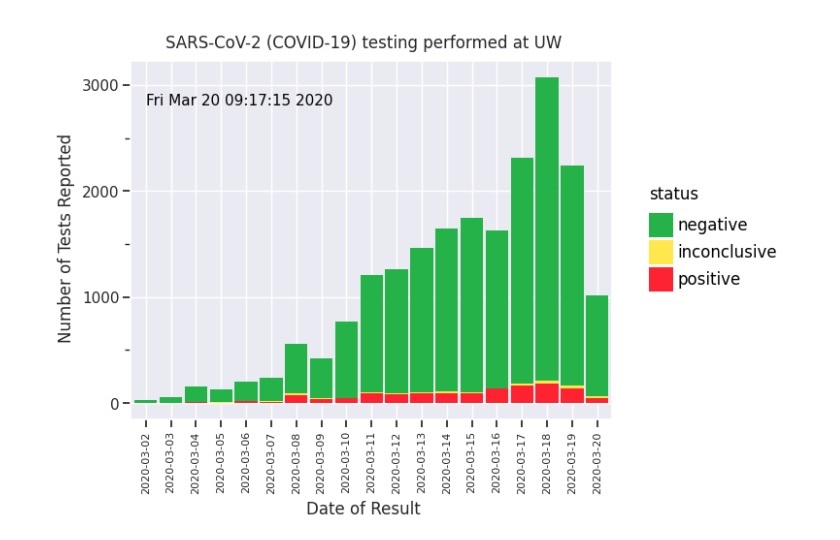
On a positive note (literally), the number of new COVID-19 cases detected by UW Virology is relatively flat. We are now 5 days into the most stringent social distancing rules and practices (March 20).
Although the results are promising, this is not the time to let up.
This graph is a snapshot of the past. According to the CDC, “The following symptoms may appear 2 to 14 days after exposure: fever, cough, shortness of breath.” COVID-19 tests are (effectively) rationed. A patient must meet testing criteria such as COVID-19 symptoms, contact with a known COVID-19 case, or travel from a COVID-19 hot-spot. Thus, the graph shows cases that are 2 to 14 days after infection.
Social distancing in Washington State did not “get serious” until March 16. The next three weeks (21 days) will tell us if social distancing in Washington State has really been effective in slowing the spread of COVID-19.
The curves (again)
Quoting the San Francisco Chronicle, “More than half of Californians could be infected with the new coronavirus over an eight-week period if nothing is done to stop it, according to a projection from Gov. Gavin Newsom’s office.”
Let’s hope this statement motivates California’s to adopt social distancing, hygiene and other measures suggested by health autorities.
Gov. Newsome is referring, of course to the orange curve in the now well-known CDC “flattening the curve” chart. If Californians (or the citizens of any other region or city) do not practice social distancing, then new cases will grow exponentially and hospitals, doctors and nurses will be overwhelmed.
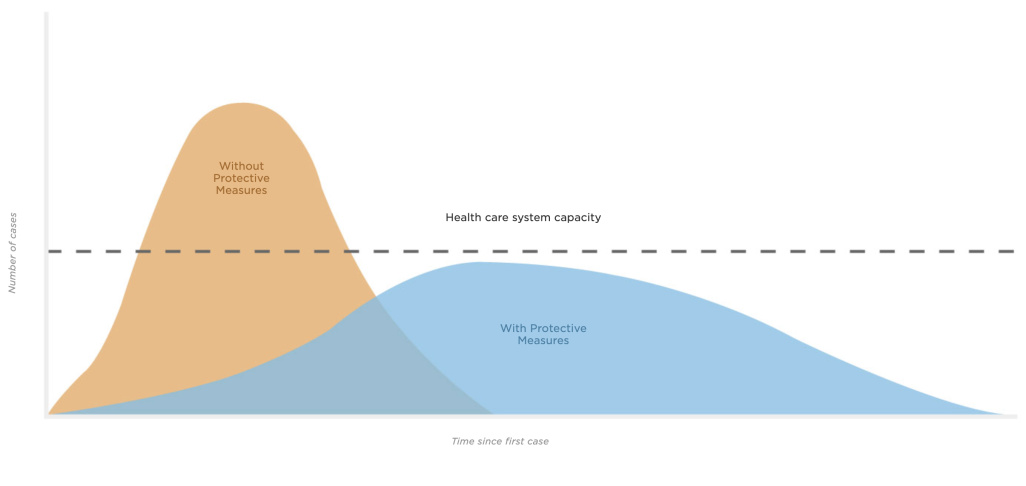
Source: CDC, Drew Harris (Connie Hanzhang Jin/NPR)
Why “eight weeks” and why “more than half?”
Epidemiologists have studied disease for a very long time. And, like any other science, they have built mathematical models to predict the growth and decline of epidemics. The SIR model (Susceptible, Infectious, Recovered model) is one of the simplest — and classic — models. Typically, these models are driven by parameters such as the reproduction number, R0, pronounced “R naught”. R0 is the average number of people who catch the disease from one contagious person.
- If R0 is less than one, then the disease will die out.
- If R0 is one, the disease remains alive, but does not break out into an epidemic.
- If R0 is greater than one, then the disease will spread, possibly growing into an epidemic.
The epidemiologists advising Gov. Newsome have plugged different values of parameters like R0 into their models, run the simulation and assessed the resulting statistics.
“Flattening the curve” essentially means reducing R0 as much as possible.
Here’s the rub which may have escaped some folks. The same number of people will catch the disease (COVID-19) in both the orange unmitigated scenario and the blue mitigated (social distancing) scenario. For the mathematically inclined, the area under the orange curve is equal to the area under the blue curve. The onset of the disease is delayed for some people in order to reduce the strain on the health care system.
The long haul
I started this blog post with statements that more realistically indicate the duration of our battle with COVID-19.
Ideally, we could like to control the growth of COVID-19 (the ramp up) and then stomp it out of existence (the ramp down). Unfortunately, real-world systems tend to behave more like the predator/prey model.
Viruses are opportunistic and adaptible. As long as SARS-CoV-2 circulates in the community, it will find susceptible individuals and infect them. Therefore, as soon as we reduce or abandon social distancing, COVID-19 will have a resurgence. The community will always be in danger of a resurgence as long as SARS-CoV-2 can find enough susceptible people to infect and thrive.
In the opinion of many health experts, our bodies likely acquire an immunity to SARS-CoV-2 as we fight and recover from the disease. At some point, when the so-called “herd immunity” is high enough, the disease will have trouble sustaining itself. We also anticipate a vaccination program against SARS-CoV-2 which will add to the herd immunity. [Yeah, no one likes to be thought of as a “herd”.]
Viruses are composed of proteins and nucleic acid. Without deep-diving molecular biology, viruses contain a form of genetic material: RNA, DNA or possibly both. Viruses usually depend upon a host cell for replication. Short story: viruses can steal genetic material anywhere in this process and mutate. Some mutations are bad and the mutants die out. Some mutations are good and the mutants thrive. That’s adaptation, that’s evolution.
SARS-CoV-2 could mutate. The mutated strain could thrive and grow because acquired immunity and/or the vaccine are specific to the original SARS-CoV-2 strain. Mutation could bring about a resurgence of COVID-19 although the underlying pathogen would be genetically different.
Realistically, it will be difficult to maintain stringent social distancing. We want to be together socially and we will definitely want to get our economy back to full strength, too. In the long haul, we should expect to see cycles of COVID-19 resurgence and decline. We may need to re-impose social distancing to keep COVID-19 in check.
Stay healthy and stay distant — P.J. Drongowski