
As noted in previous posts, data from the Washington State Department of Health (DOH) lags a little bit as reports arrive from county health departments. So, the DOH chart (below) covers the period up to May 16 (about ten days ago at the time of this writing).
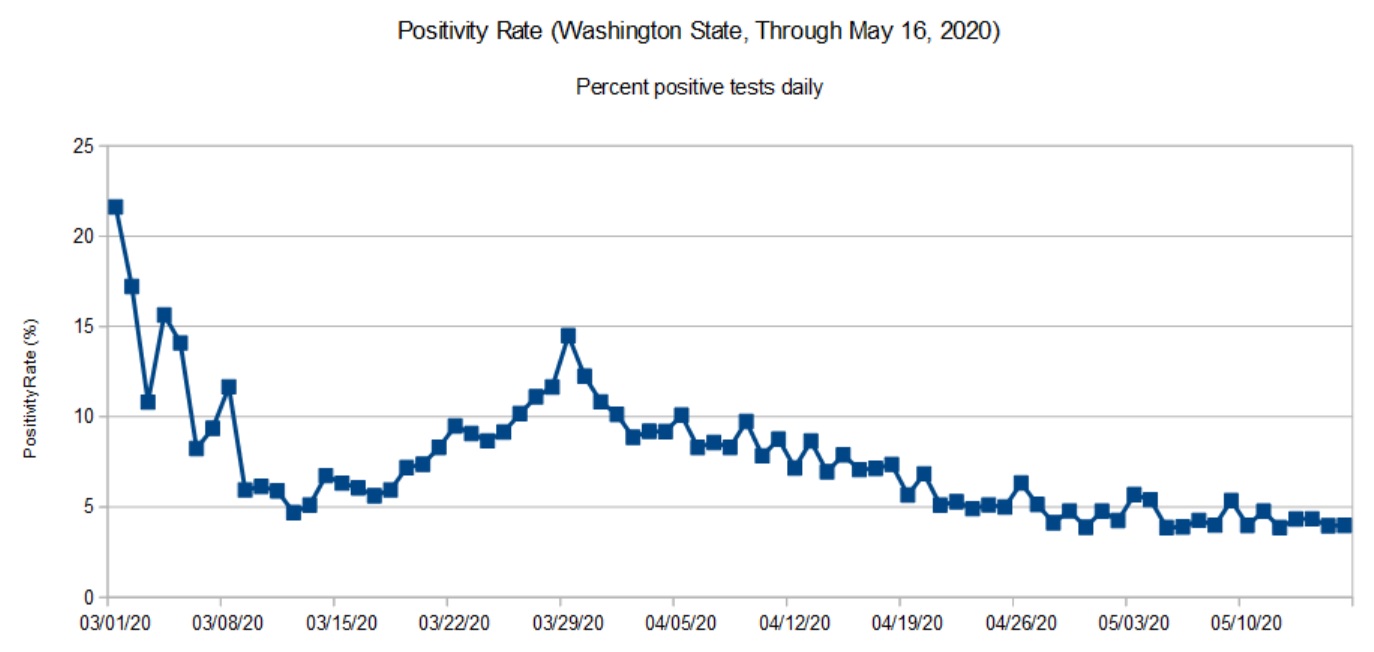
The trend in the DOH daily positivity rate (percent positive tests per day) is decidedly downward. It’s worth noting, however, how fast a community can move up the curve than down. The difference between the upward slope and downward slope should make people cautious — we don’t want to be on the wrong side of the curve again. It’s better to knock the disease to its knees and keep it there than to suffer a series of waves, even small waves.
The data from the University of Washington Virology Laboratory (UW) has shown a sharp up-turn in recent days. [Click on images to enlarge.]
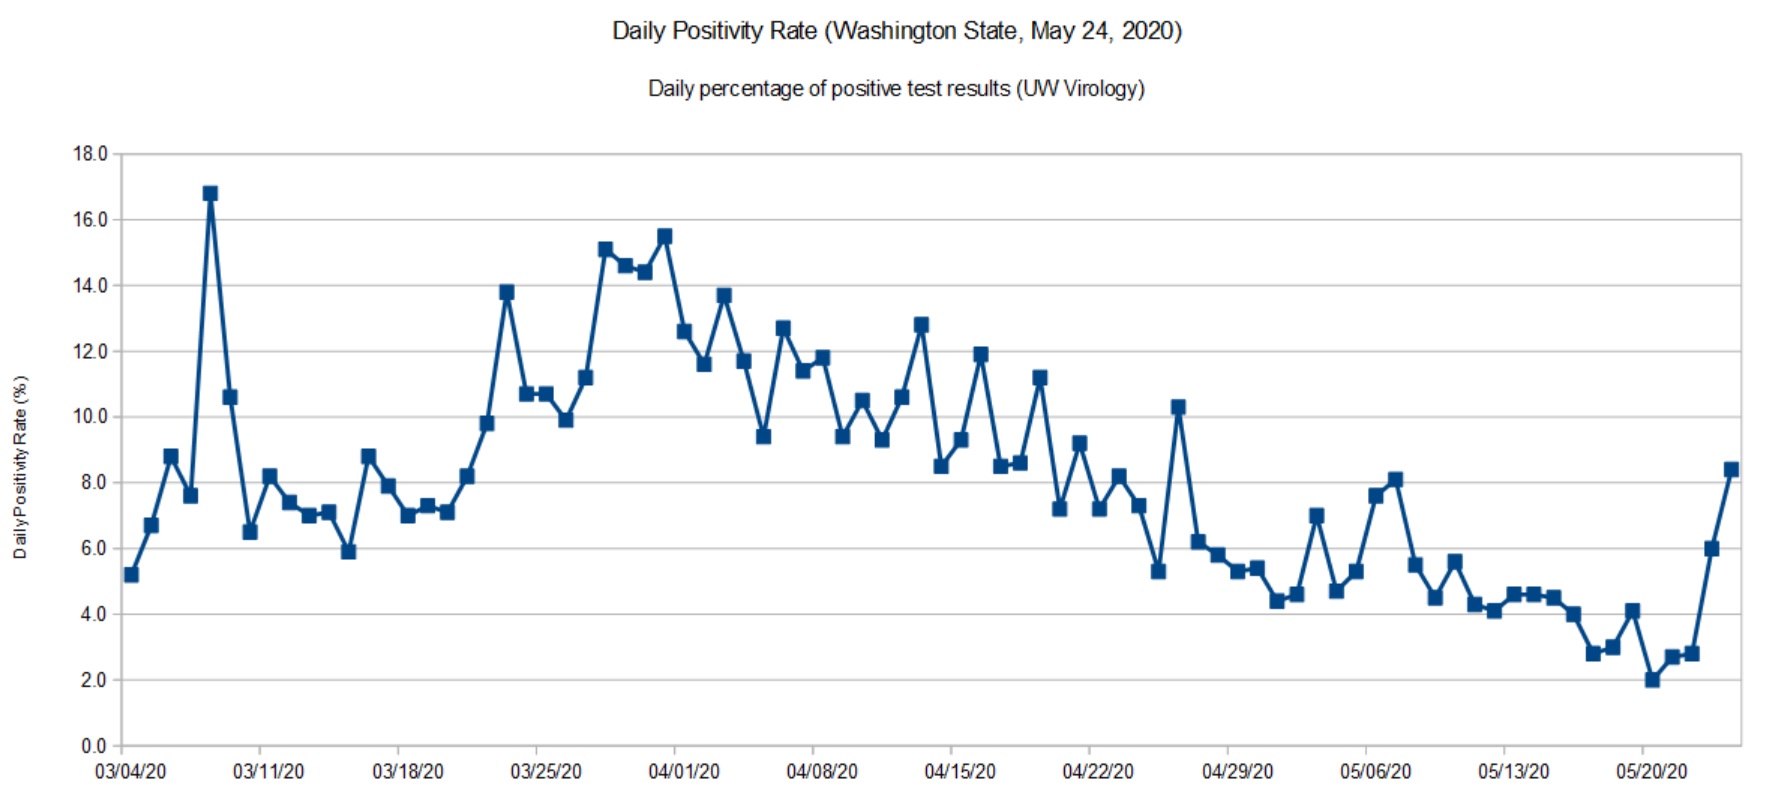
I don’t see a similar up-turn in the latest daily stats from the DOH, so I’m quite curious as to the cause for a higher positivity rate in UW’s most recent data. Did the lab test more samples from a COVID-19 cluster under investigation? Are there quality issues with the samples or test materials? I hope that they are looking into these questions.
I recommend reading this excellent report from the Imperial College COVID-19 Response Team: H Juliette Unwin, Swapnil Mishra, Valerie C Bradley et al. State-level tracking of COVID-19 in the United States (21-05-2020), doi: https://doi.org/10.25561/79231
The report provides a timely analysis and summary of COVID-19 in the United States, including an estimate of the effective transmission rate (Re) for each state. The report is licensed under a Creative Commons Attribution NonCommercial NoDerivatives 4.0 International License.
Stay healthy — P.J. Drongowski