Time for what’s known in the journalism biz as a “round-up.”
I started blogging about COVID-19 numeracy (AKA “by the numbers”) as a way to get my head around all of the data thrown at us by media outlets. Blogging also gave me a way to have the illusion of control over that which I cannot control, namely, the spread of COVID-19.
I hope that my blog posts are a resource for math and science teachers. (I try to keep these posts free of politics, BTW.) If there is a silver lining in all of this, what an opportune time to teach critical thinking and numeracy! I tried to collect the best and most useful examples of data presentation and, I collected a few stinkers, too.
So, here they are, links to my blog posts about COVID-19 numeracy:
If you’re a regular reader, you know that I usually deep-dive music technology and electronics. Fear not, I have been plugging away on music projects, too: Blokas MidiBoy, Toontrack EZKeys, recording demos with Genos, and more. All the projects for which I didn’t have time. Guess I’ve got the time now, just like everyone else. 🙂
I hope to blog about music-related topics as I’m not sure how much value I can add to the on-going COVID-19 discussion. I will continue to track the positivity rate for Washington State since this is my home with family and friends nearby. Plus, there are always subjects (e.g., reverse transcription polymerase chain reaction/RT-PCR testing) that pique my scientific interest.
Washington Post: Bending the curve
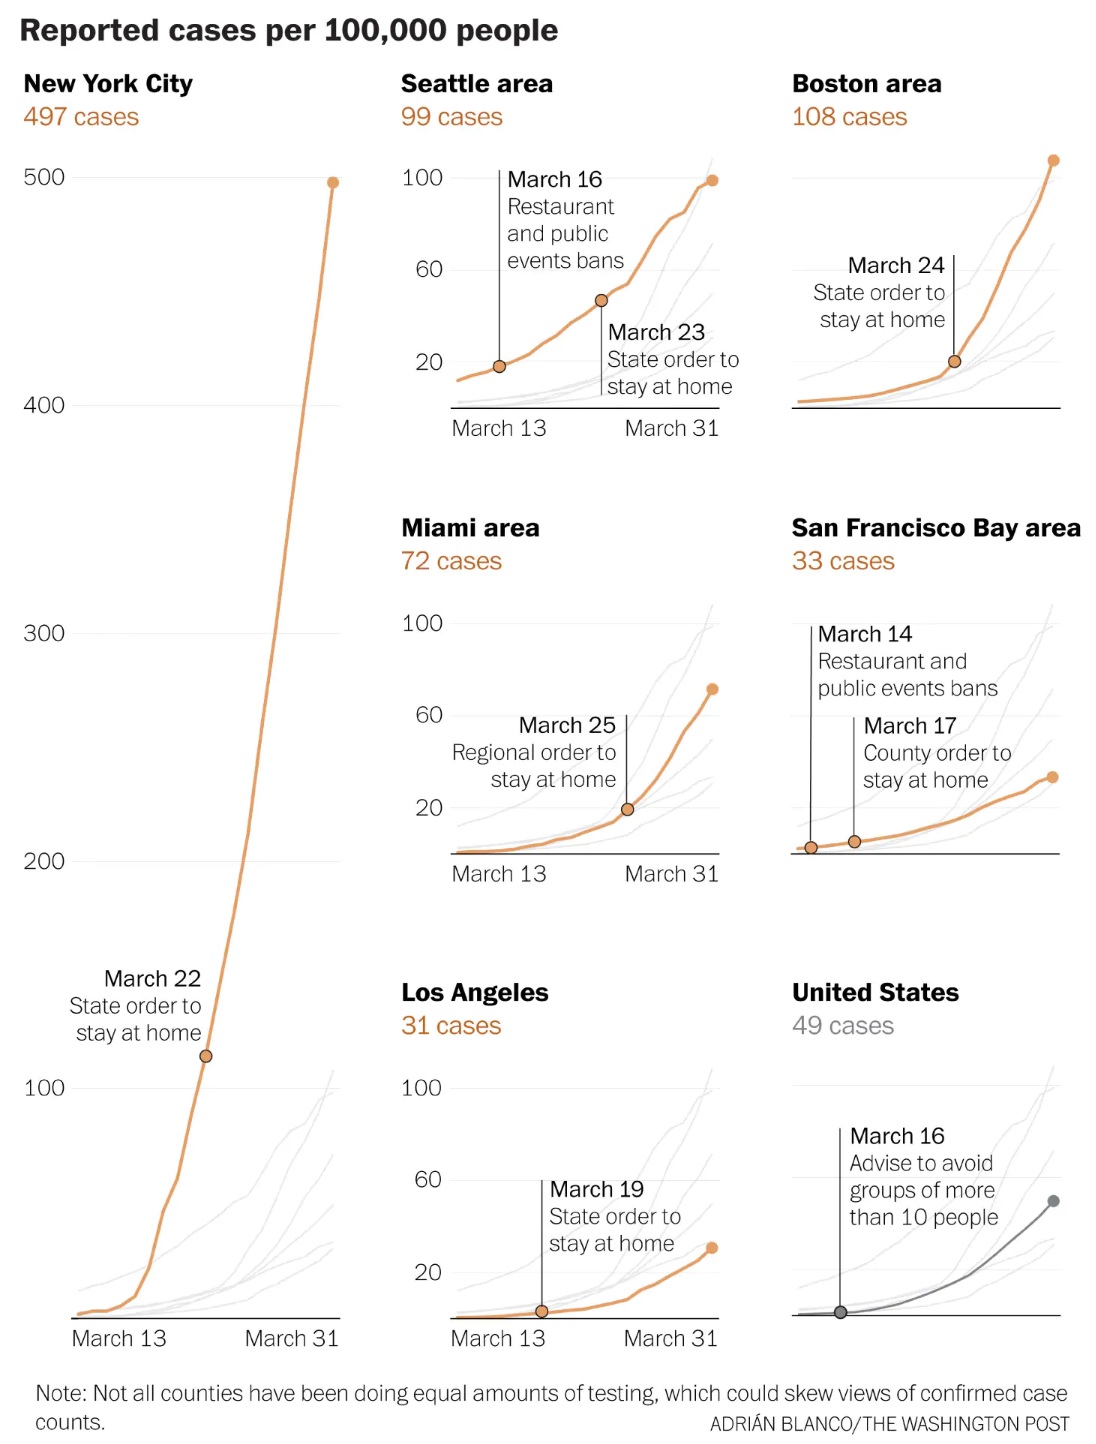
Here’s a quick hit from the Washington Post. It’s a set of graphs illustrating the effect of social distancing for select U.S. cities.
Source: Washington Post (April 2, 2020)
With respect to Washington State (Seattle), it’s still early days, really. I think my original guidance holds — we won’t really see a bend from another 7 to 14 days out from this point (April 2). Washington State imposed its first social distancing on March 16 followed by a stay-at-home order on March 23. With the delay due to SARS-CoV-2 incubation, development of symptoms, clinical presentation and testing (10 to 14 days according to medical experts), we should just now be seeing a bend in the curve.
The Washington State Department of Health (WADOH) has had technical issues with its disease reporting database. The original database could not handle the incoming stream of reports including negative test reports. So, the WADOH database went dark for a few days recently and is just now coming back. Due to these technical glitches, we need a little extra time to see the effect of social distancing in Washington.
Stay apart and keep all of us healthy — P.J. Drongowski
A New York Times article (March 29) suggests that social distancing is beginning to pay off in the Seattle area. The NYT article refers to work performed at the Institute for Disease Modeling in Bellevue, WA. The authors are cautious saying that data is preliminary and unpublished.
Quoting the IDM web site:
IDM shapes global efforts to eradicate infectious diseases and to achieve permanent improvements in the health of those most in need. By developing, using, and freely sharing computational modeling tools, we advise policymakers, promote quantitative decision-making and advance scientific methodologies.
IDM is an institute within the Global Good Fund, a collaboration between Intellectual Ventures and Bill and Melinda Gates.
Currently, IDM is working on disease transmission dynamics for malaria, polio, tuberculosis, HIV, pneumonia, typhoid, and more.
Personal thanks to Bill and Melinda Gates for their philanthropic work.
IDM published a report (as of March 29) on the effects of social distancing and mobility reductions on COVID-19 in King County, WA. Quoting the report:
Still, based on this data for King County, the trend clearly shows Re decreasing from about 2.7 in late February to roughly 1.4 on March 18th. These estimates come with high uncertainty, and while the trend is encouraging, it remains unlikely that COVID transmission in King County was below the 1.0 threshold on the 18th.
[We] cannot say with confidence if Re is below or above the critical threshold of 1 today.
Re is the effective reproductive number for COVID-19.
Thank goodness, Governor Inslee is not declaring victory either. Community mitigation measures remain in place and likely will be extended. (The federal guideline is currently April 30.) In his interview on CNN’s “State of the Union” on Sunday, the Governor cited shortfalls in testing supplies (swabs, vials, etc.) which are limiting the number of tests performed daily. As I’ve said before, we need community-wide epidemiological studies to get ahead of the disease. We cannot perform epidemiological tests (surveillance testing) when we can barely perform diagnostic testing for symptomatic patients.
The Fine Print
Let’s get nerdy. How do IDM define R0 and Re. Quoting the IDM glossary:
R0 (R Naught, Basic reproductive number): The average number of secondary cases a typical infectious individual will generate without any interventions in place to reduce transmission. The number of secondary cases per source is expected to change over time and space with different interventions and as the proportion of the population with immunity grows (REff).
REff (R Effective) or Re: The number of secondary cases each infectious individual will generate, on average, after interventions are in place and/or part of the population is immune. We would expect REff to be less than R0.
Washington Department of Health
The Washington State Department of Health upgraded COVID-19 reporting on their web site. They are publishing better graphs and data, especially data about testing. I’d like to see graphs for the posivity rate over time since the ratio of daily positive tests divided by the daily number of tests adjusts for day-to-day variations in testing. (“Daily” means for each 24 hour period.)
Positivity Rate
Governor Inslee referred to this ratio as the “Positivity Rate” and I like that term. It’s more concise than “Percentage of positive tests per day.”
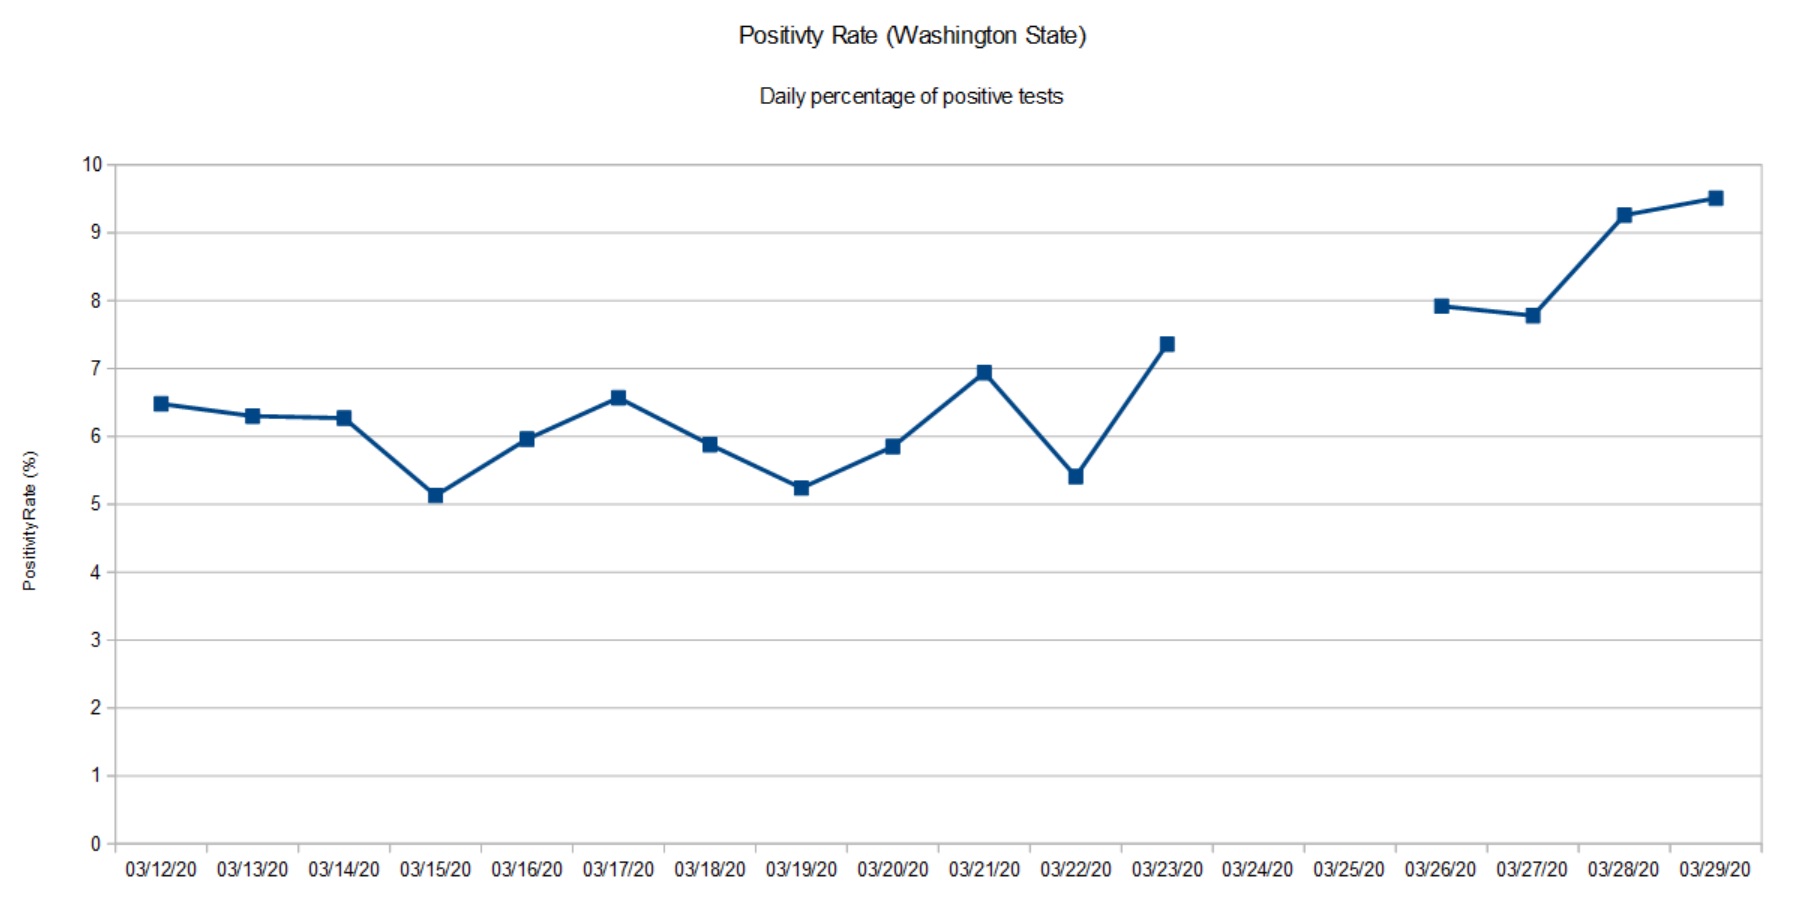
Below is my plot of the Washington State positivity rate starting March 12 to March 29. Although the press is optimistic, The positivity rate has doubled over the time period. [Click image to enlarge.]
Washington State Positivity Rate (March 12 to March 29)
The gap in the graph is due to missing data from the Washington State Department of Health. They ran into database glitches March 24 and 25. The March 26 data point aggregates positive cases and tests across the gap.
There are several factors that affect the positivity rate. First off, this is not a random sample of the population at large. People are tested only if they satisfy a protocol, that is, satisfy a set of criteria. Criteria include presence of COVID-19 symptoms (fever, cough, shortness of breath), contact with a known infected COVID-19 patient, or in-coming travel from a known COVID-19 hot-spot (e.g., China, Italy, New York City metro, etc.) No doubt, some of the tests are due to contact tracing as officials try to identify possible carriers in order to isolate them. Bottom line, the positivity rate is far from a controlled epidemiological study (surveillance).
Please remember that any measurements we take today show what the virus (SARS-CoV-2) was doing 10 to 14 days ago. The delay is due to incubation, development of symptoms, clinical presentation and testing.
At this point in time (March 30), I’m glad that Washington State is staying the course and is looking at additional restrictions.
BTW, I’m still trying to absorb the changes to the Washington State Department of Health site. Their graphs don’t always jibe with my table of previously published data.
At the beginning of March, The Skagit Valley Chorale discussed weekly rehearsals and whether they should go ahead. Skagit County had not yet reported any cases of COVID-19. On March 6, they decided to go ahead with rehearsal on March 10. The chorale members used hand sanitizer and minimized contact during rehearsal.
None of those precautions, however, prevented an outbreak. Three weeks later, 45 members have been diagnosed with COVID-19 or have had symptoms. At least three members were hospitalized and two are dead.
Fortunately, our own church group passed on rehearsal during the same time frame.
This tale should be a warning to any community that feels safe because they have not yet experienced the disease. Please pay attention to our public health officials who predict eventual outbreak everywhere. Start social distancing and isolation now.
    Car crash fatalities (2019)    38,800 people
    Vietnam War fatal casualties   58,220 people
    Hiroshima fatal casualties     90,000 to 146,000 people
    Nagasaki fatal casualties      39,000 to 80,000 people
    COVID-19                       ?
Yesterday, CNN carried interviews with Dr. Anthony Fauci and Bill Gates. Both gentlemen called for community-wide epidemiological studies of COVID-19. We need to know the prevelance of the disease in our communities in order to assess the effectiveness of community mitigation (i.e., social distancing).
Broadly speaking, there are two kinds of COVID-19 testing:
Diagnostic testing
Epidemiologic testing
Diagnostic testing is patient-focused. It determines if the tested individual is infected with SARS-CoV-2 (the virus which causes disease COVID-19) in order to isolate and treat the patient. Due to limited test capacity, all testing to date is diagnostic in purpose.
There are variants of diagnostic testing on the horizon such as a test to determine if an individual has acquired immunity to COVID-19 or not (antibody testing).
Epidemiologic testing is like a political poll. People are selected at random from the community, statistically called the “population.” The selected people are tested for SARS-CoV-2 infection using the same kind of medical test employed in diagnostic testing. Personal information is also collected such as age, sex, presence of underlying medical conditions, previous COVID-19 diagnosis, and so forth. Statistics are tallied and summarized such as the percentage infected, susceptible (not yet infected) and immunity. Like a political poll, the statistics are broken out by age, sex and so forth.
We have not yet performed a single community-wide epidemiological study of COVID-19. This leaves us blind to one important segment in the community — people in the community who are infected and are asymptomatic. We know that asymptomatic people are a significant factor in the spread of SARS-CoV-2 and COVID-19.
Impatient people are already chomping at the bit to restart the American economy. Given that we are only 2 weeks (at best) into community mitigation, this is preposterous. [Some communities have not even started social distancing and they are late.] At some point, though, we must restart the economy. Epidemiological studies will help us to decide if it is safe to reduce community mitigation and allow the free flow of commerce again.
One important factor in the decision to reduce mitigration is the degree of immunity in the community, the so-called “herd immunity.” The community (the herd) becomes protected from a disease when a large portion of the population (typically, 60%) is immune to infection. Infected individuals often become immune when they successfully fight off and recover from the disease (acquired immunity). Better yet, individuals can be made immune through vaccination.
Acquired COVID-19 immunity has not been confirmed by scientific study at this time. Based on prior experience with other coronaviruses, medical experts believe that recovered individuals will be immune to SARS-CoV-2.
“Flattening the curve” has two benefits. First, it reduces the strain on the health care system (hospitals, doctors, nurses and other caregivers). Second, it buys us the necessary time to develop a safe vaccine and to get a vaccination program ramped up and put in place. In some sense, developing the vaccine is the easy part. The time-consuming part is the medical trials and studies needed to assume safety and efficacy.
The Seattle Flu Study was initially started to detect, monitor and control influenza outbreaks in Seattle using rapid virus genetic sequencing and mapping chains of transmission. The study is led by the Brotman Baty Institute, in collaboration with UW Medicine, The Fred Hutchinson Cancer Research Center, and Seattle Children’s.
With the outbreak of COVID-19, the Seattle Flu Study was “repurposed” to COVID-19. Quoting:
To track the spread of COVID-19, SCAN will collect nasal swabs from a sample of people across Seattle and King County, working to mirror the area’s population as closely as possible. We’ll collect swabs from both those who are healthy and those who feel sick and will also test de-identified clinical residual samples (these are left-over samples from tests performed for other reasons at clinical laboratories). The results of these tests will help us understand the outbreak more completely and, along with other data sources, help inform public health decisions. SCAN is not able to offer testing to every individual but the whole community will benefit from the program.
I look forward to the results of the SCAN study since we live a stone’s throw away from King County, Washington. This is our ‘hood.
Logarithmic graphs
Logarithmic graphs are good tools when analyzing phenomena with exponential growth. At this point, we’ve all seen linear scale graphs showing the steep rise of COVID-19 cases. Each tick in a linear scale graph has the same statistical weight, e.g., 100, 200, 300, 400, etc.
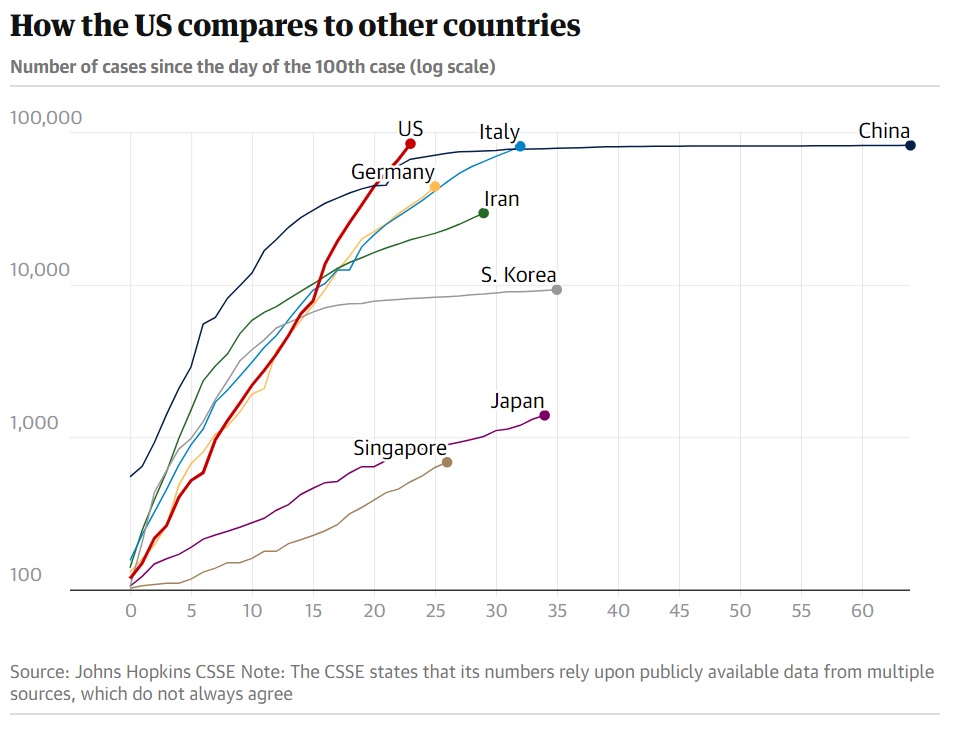
A logarithmic graph has a logarithmic scale. Each tick increases by a power of 10, e.g., 100, 1,000, 10,000, 100,000, etc. An exponential trend appears as a straight line in a logarithmic graph. Here is a logarithmic graph (from The Guardian, March 27).
Source: The Guardian (March 27)
Sadly, the United States is on an exponential trajectory. China and South Korea, in particular, have asymptotic curves, showing successul COVID-19 community mitigation. Those two countries are “flattening the curve.”
New York State Hospitalizations
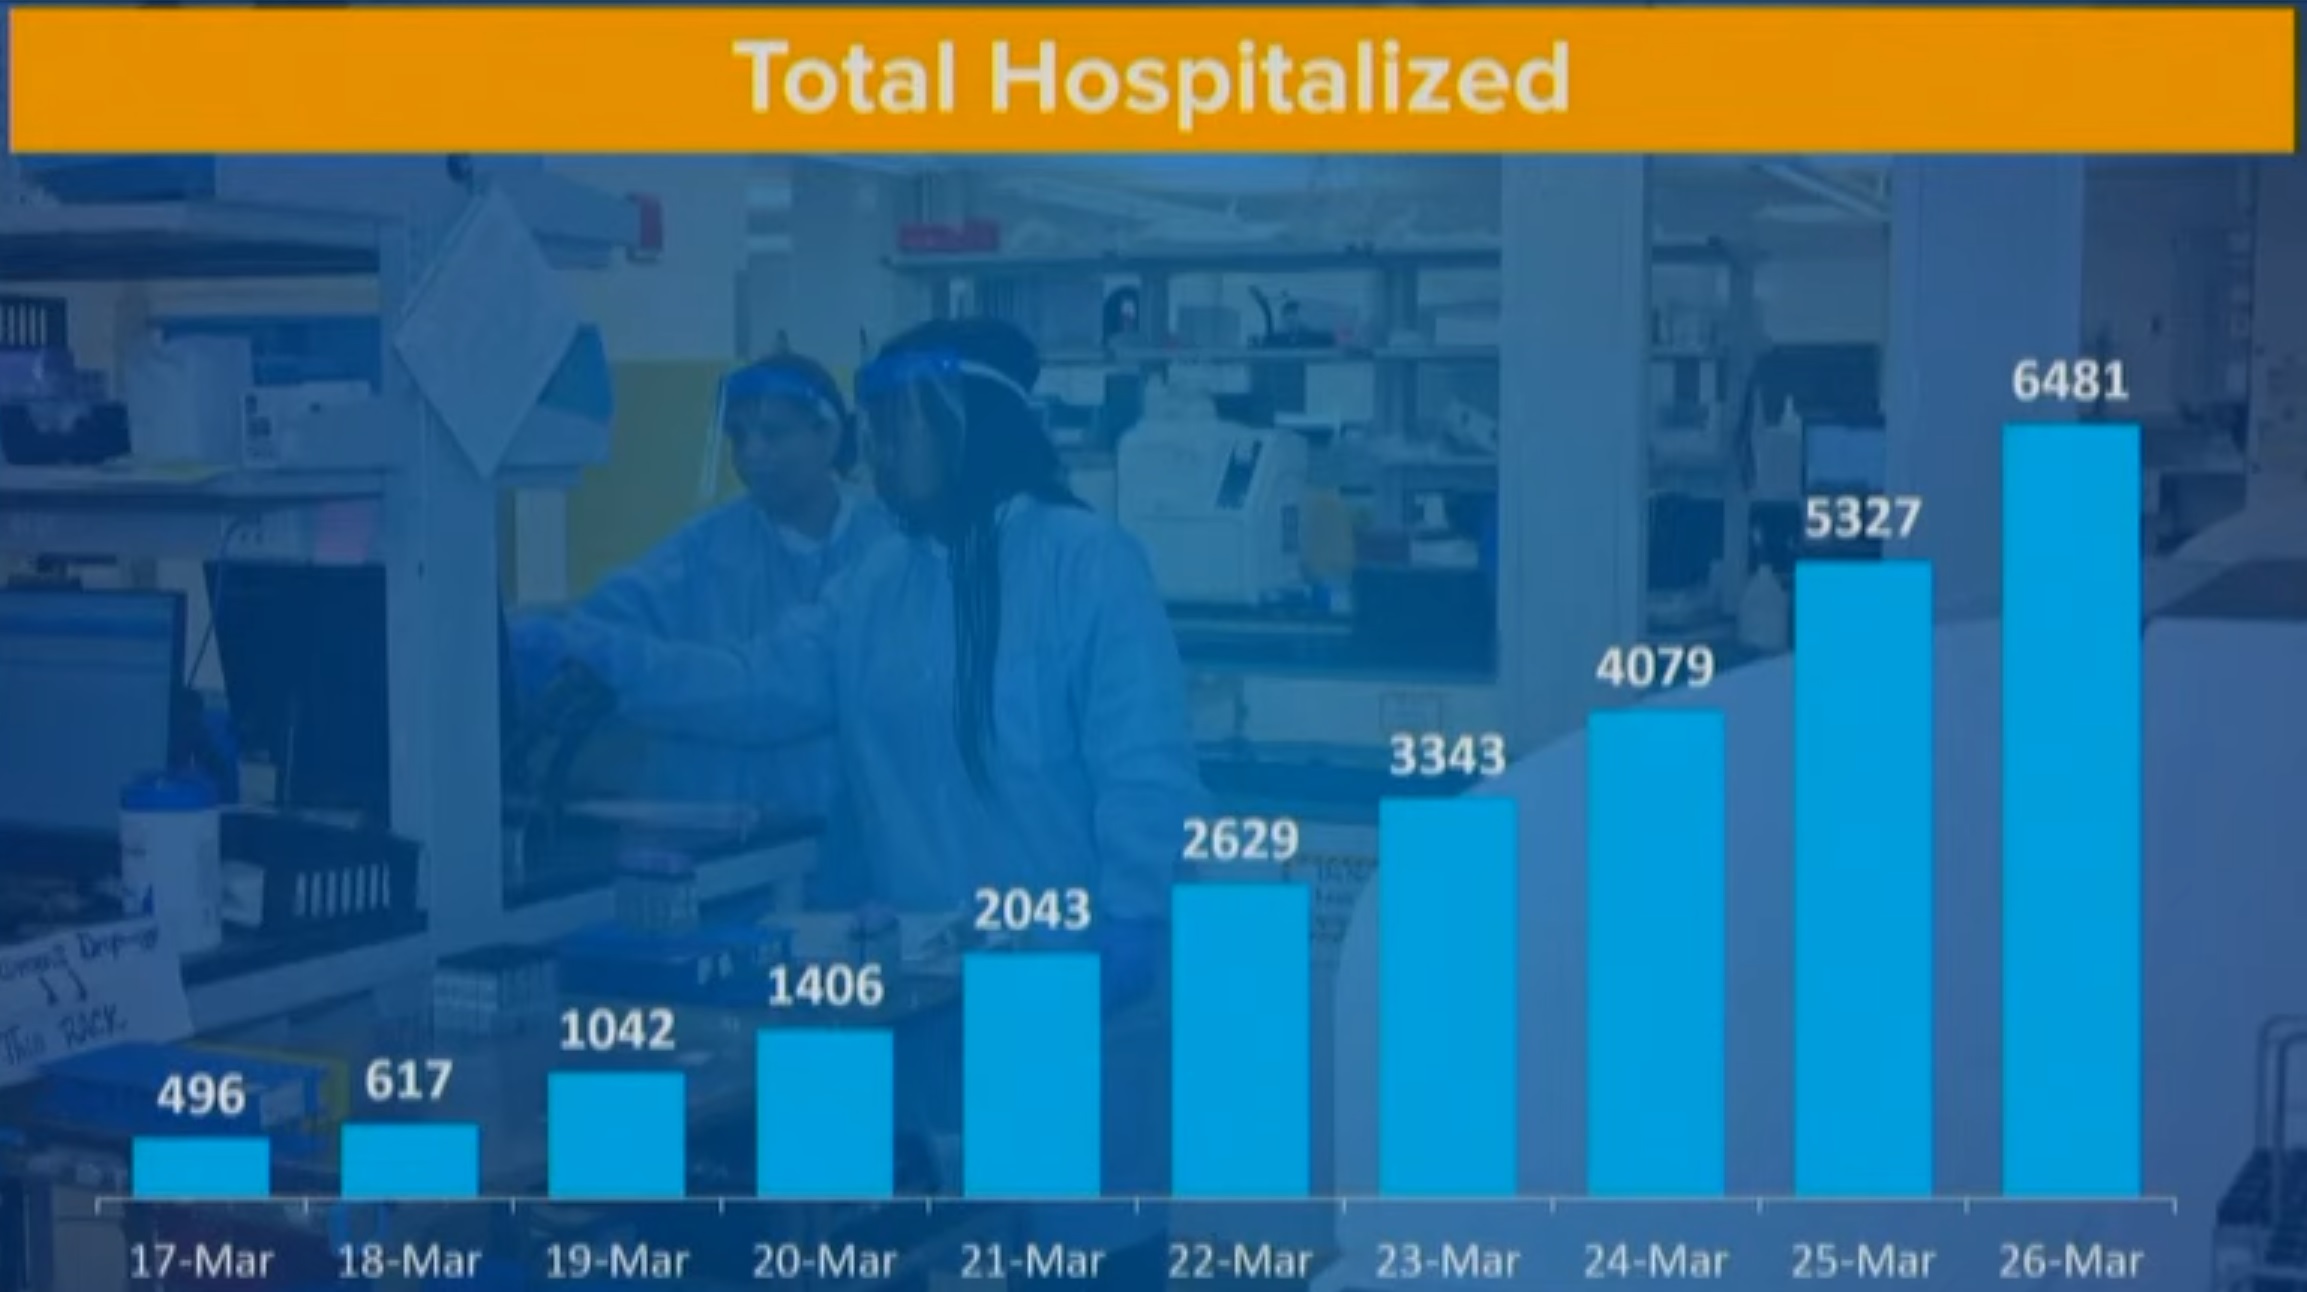
Gov. Andrew Cuomo of New York presented an important and useful graph during his briefing this morning.
New York State COVID-19 Hospitalizations Through March 26
This chart shows the number of hospitalizations per day. Please note that the number of hospitalizations is increasing by almost 1,200 new patients per day. No health care system can sustain this kind of growth. New York State expects the apex of hospitalizations in 21 days, adding a further 25,200 hospitalized patients, if the current rate continues.
As I mentioned earlier today, The New York Times staff has published some excellent maps, charts and interactive simulations.
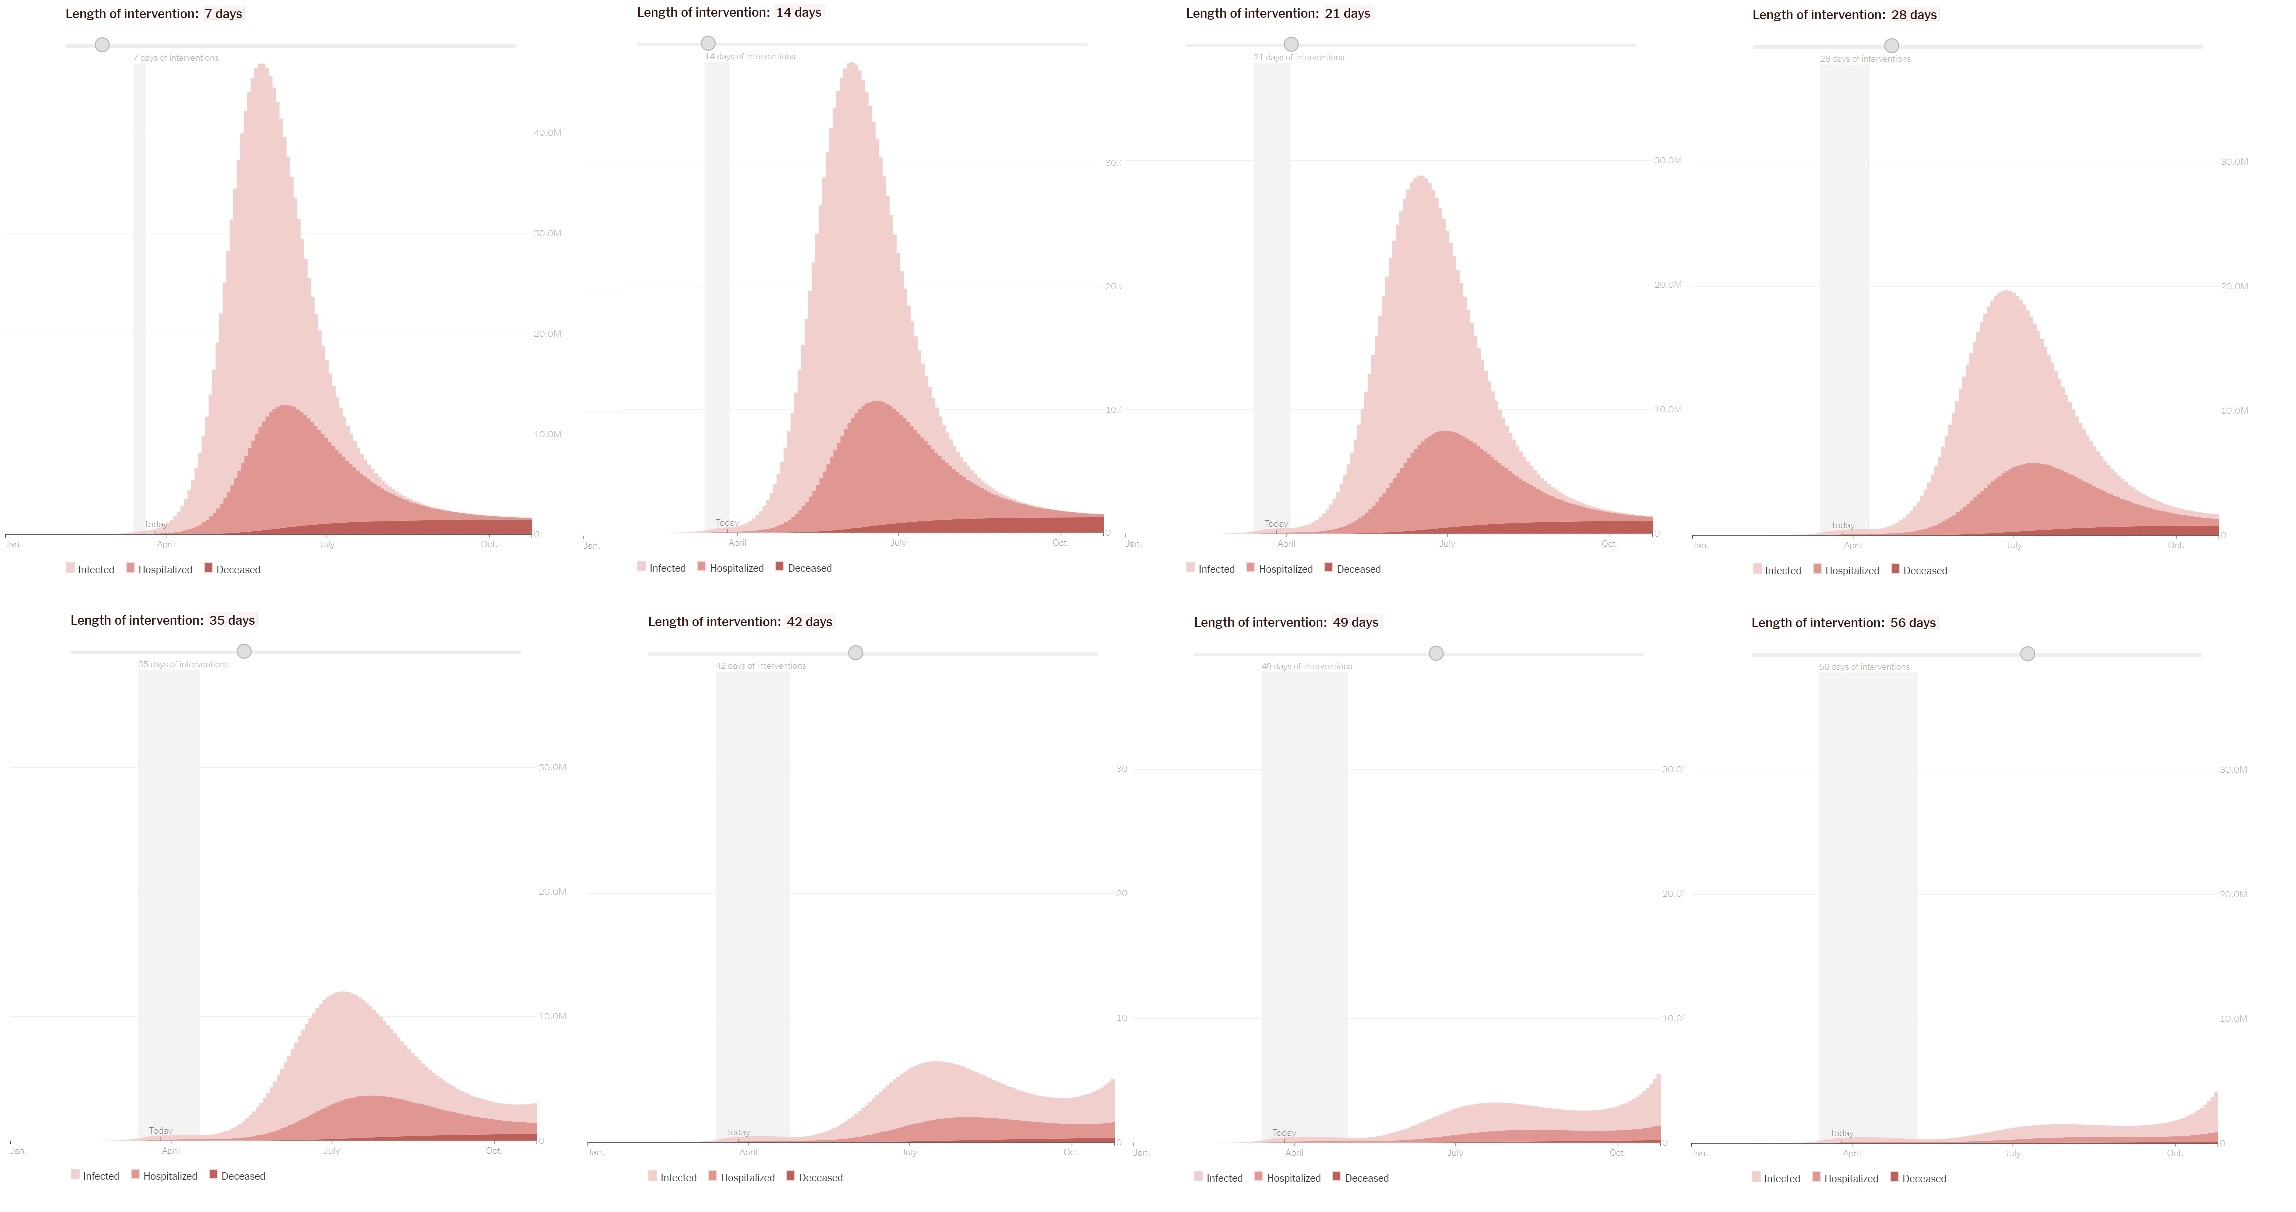
Their latest interactive simulation illustrates the effect of community mitigation (i.e., social distancing) for varying periods of time. I took snapshots at weekly intervals (social distancing for 7 days, 14 days, 21 days, etc.) [Click to enlarge.]
Effect of community mitigation for different time periods (NYT)
The curve in the lightest shade is the number of infected people. The middle shade curve is the number of people hospitalized and the darkest shade curve is the number of deaths. Each tick in the vertical scale is 10 million. Yes, millions. I recommend reading the article itself for assumptions and caveats on the mathematical model.
From this time series, it’s easy to see that two weeks (14 days) of community mitigation is wholly inadequate for suppressing the disease, let alone stopping it. To my eye, the shortest reasonable duration is 42 days (6 weeks).
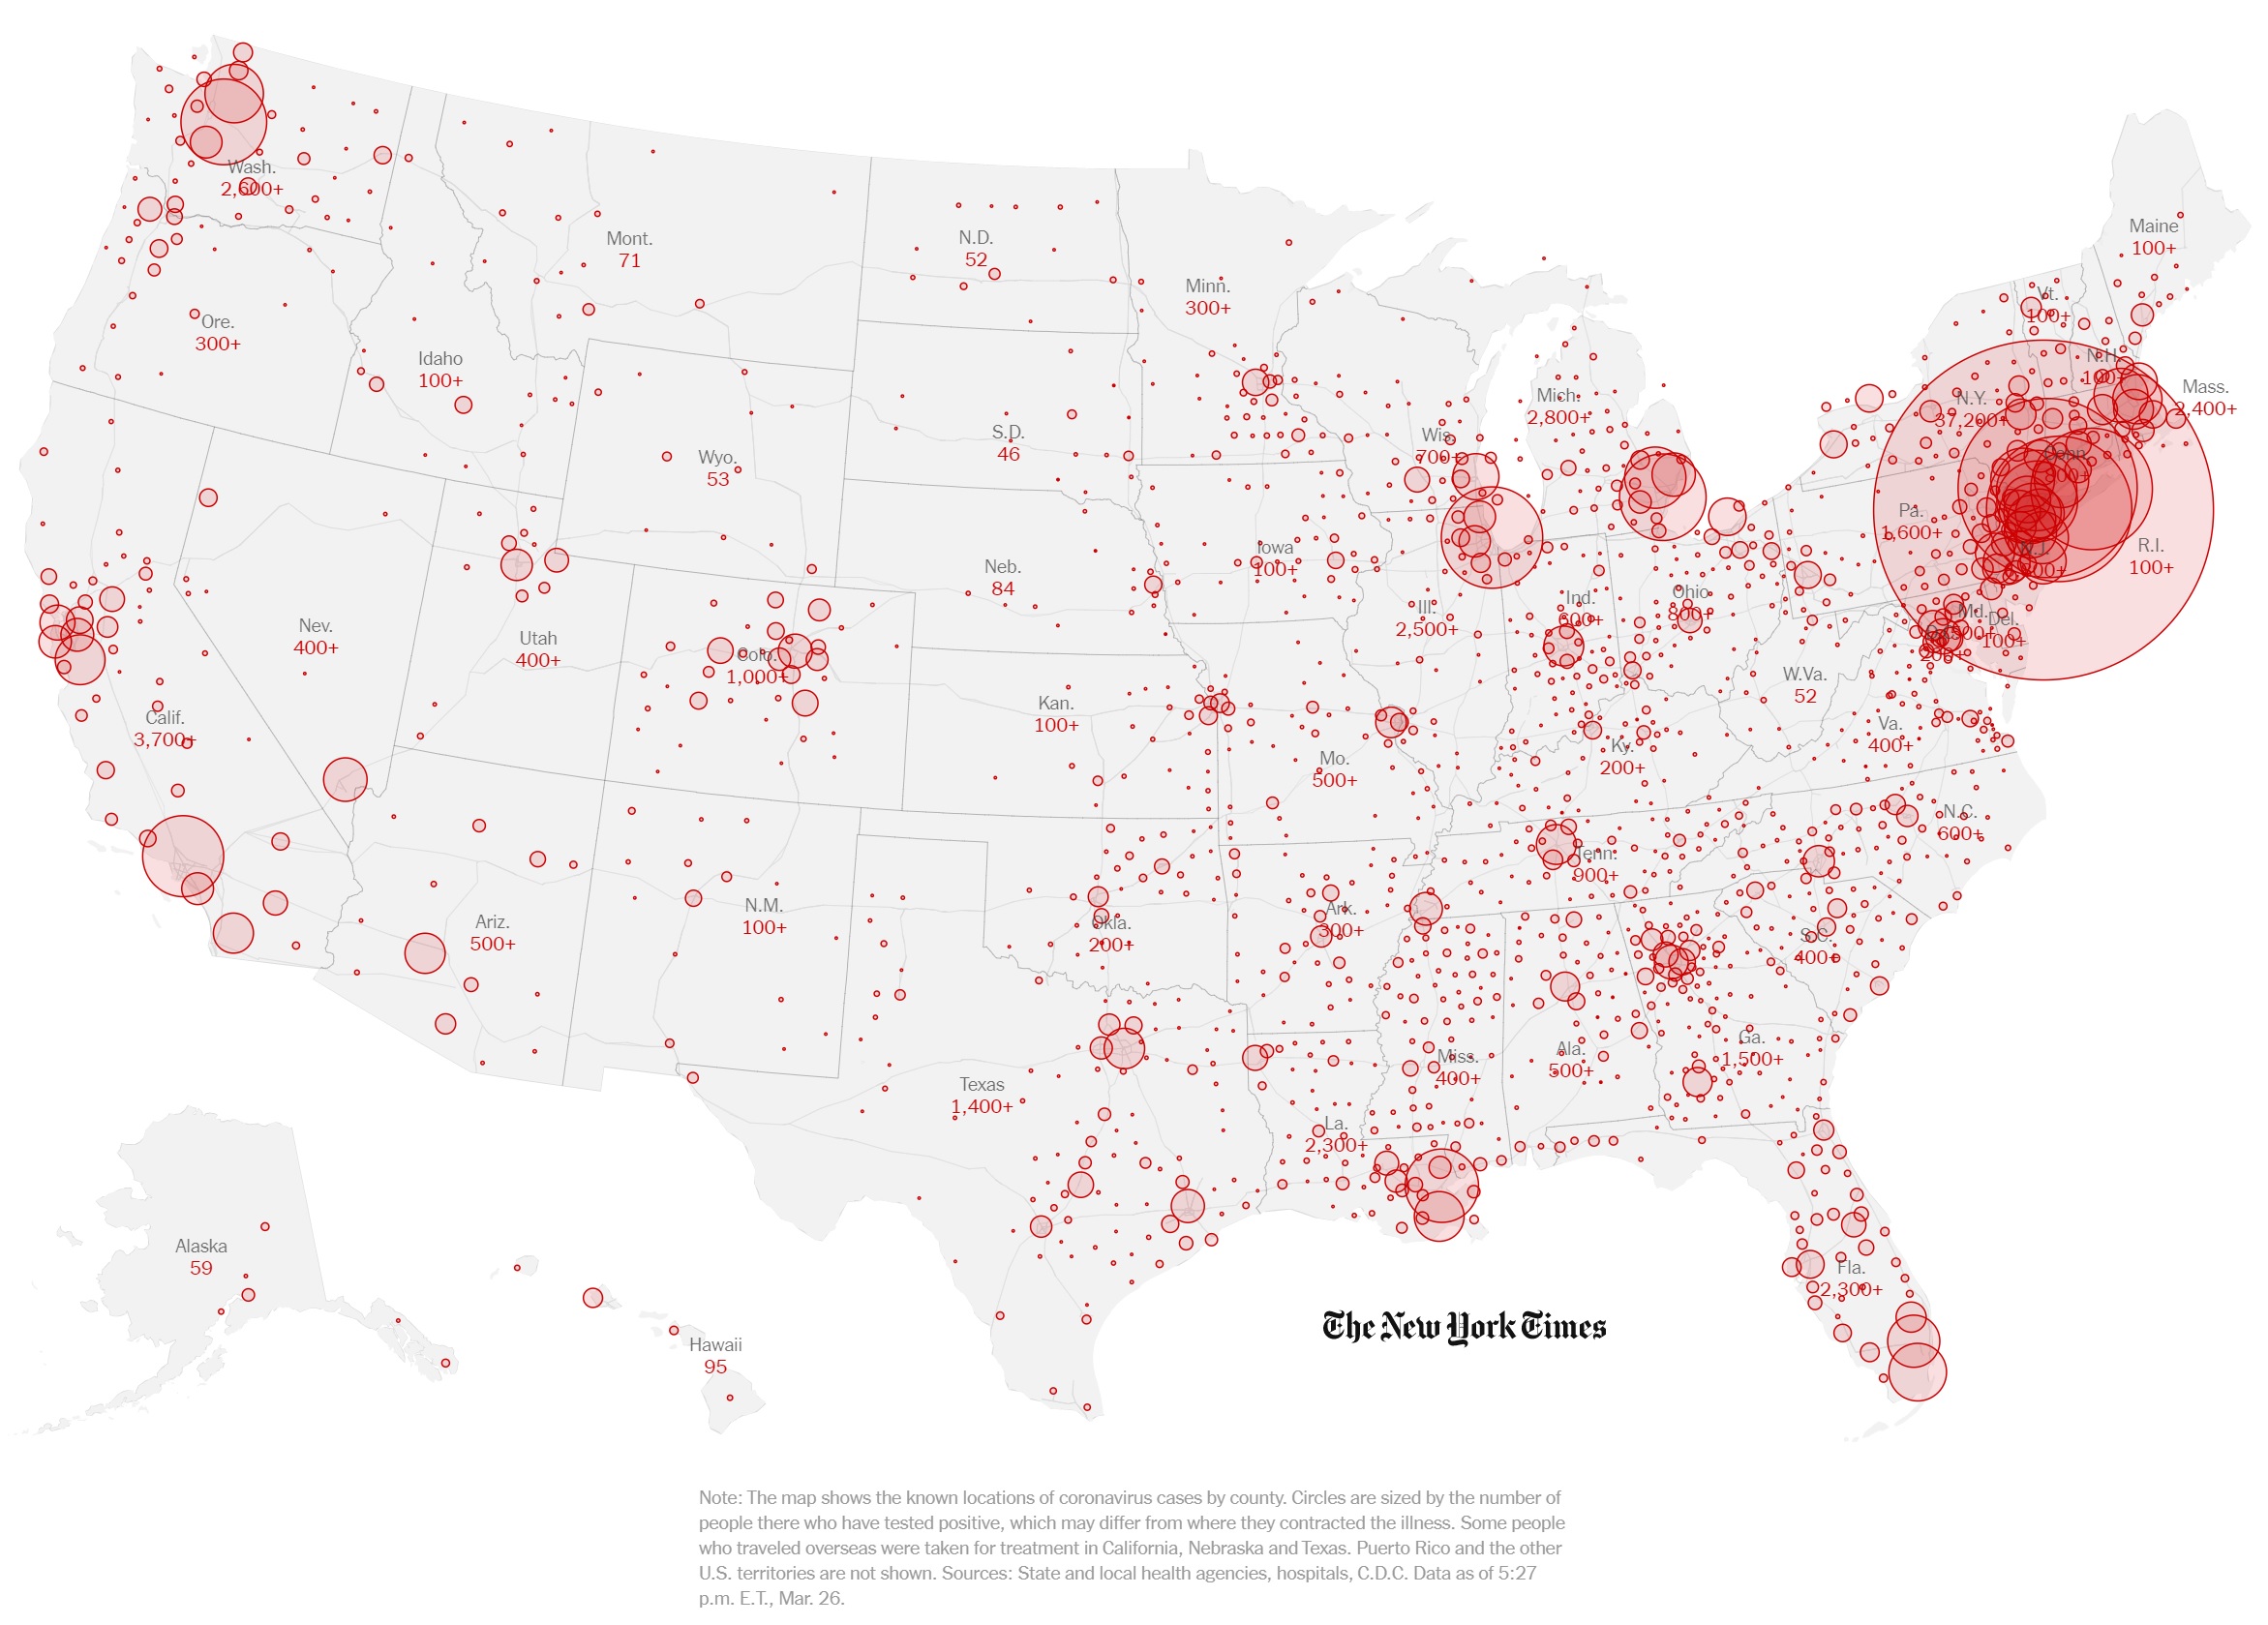
Here is the latest NYT map (March 26, 2020) depicting the spread of COVID-19 across the United States. [Click to enlarge.]
Spread of COVID-19 (The New York Times, March 26, 2020)
Dedicated to Edward Tufte, who is still kicking around, thank goodness.
Governor Cuomo, in his briefing today, asked why New York State is leading the United States in positive COVID-19 cases. Let’s compare the top four states:
                     Total   Total   Percent
    State            Tests   Cases  Positive  Date
    -------------   ------  ------  --------  ----
    New York        38,390  14,904     38.8%  3/24
    Massachusetts   13,749   1,159      8.4%  3/24
    California      27,650   2,102      7.6%  3/24
    Washington      33,933   2,221      6.5%  3/23
Indeed, New York State has the highest percentage of positive tests — substantially higher. There must be a factor in play. Could there be a difference in testing (i.e., difference in the test kits? different test protocol?) Did SARS-CoV-2 hit New York State sooner? Is COVID-19 more prevalent due to the population density in the New York City region, as the Governor speculated?
Only a good epidemiological study could really measure the prevalence of SAR-CoV-2 in the community. As to timing, I don’t think we will ever know when SARS-CoV-2 hit our shores. New York City is a major global transportation hub. Even so, Washington and California have strong business and family ties across the Pacific and Pacific rim and have major transportation hubs (Los Angeles, San Francisco, San Diego, Seattle).
If I get a chance today, I’m going to look into our neighbor to the north, Vancouver. Vancouver is also quite connected with Asia and the Pacific rim.
The Washington Department of Health has had difficulties with its COVID-19 database. Although they posted a new number of positive cases, 2,469 as of March 24, the number of negative cases was not updated, showing the same total negative test count as of March 23.
The national picture
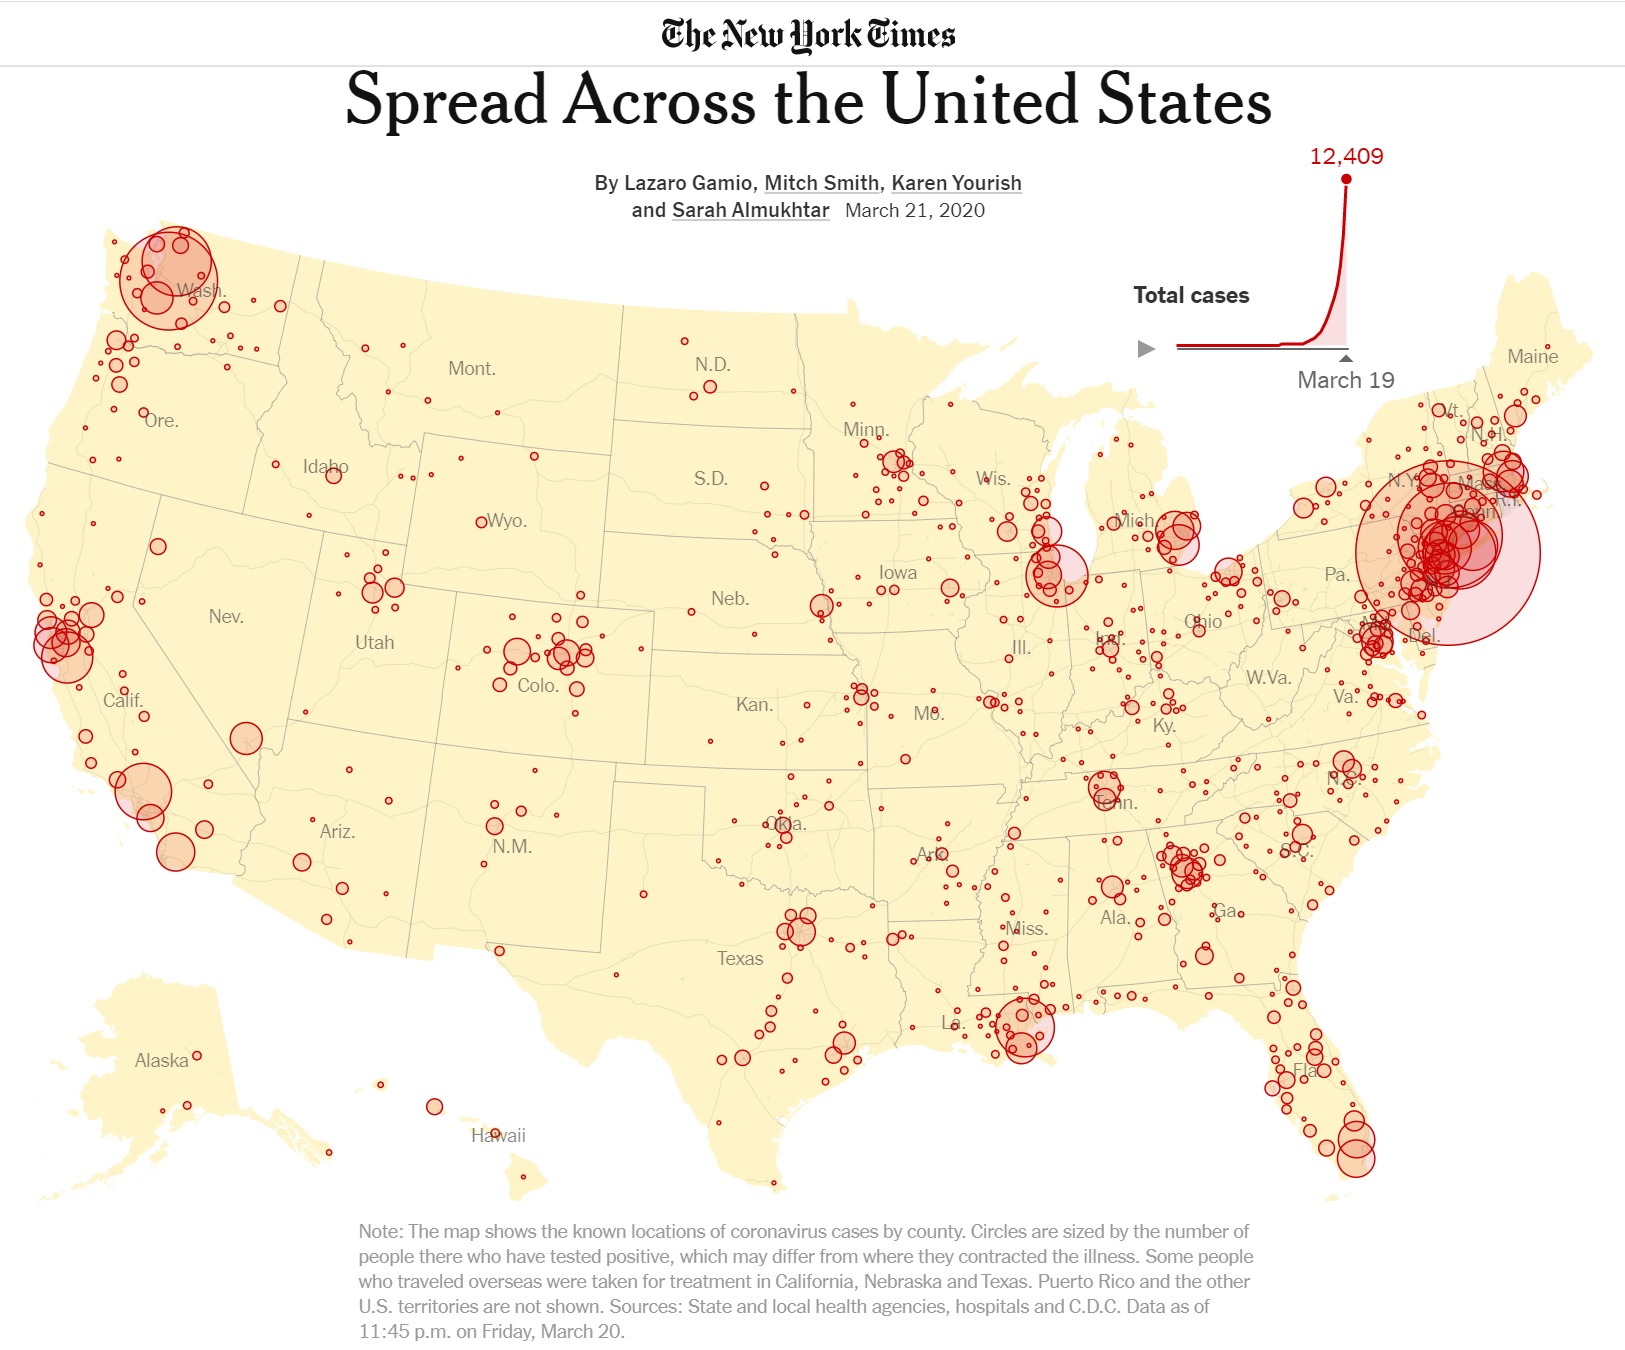
The New York Times has published many informative graphs and simulations during the COVID-19 crisis. The chart below shows the spread of SARS-CoV-2 (the virus) and COVID-19 (the disease caused by SARS-CoV-2) across the United States as of March 19, 2020.
Source: The New York Times
The chart illustrates how population density affects the number of COVID-19 cases. [Click to enlarge.] The biggest circles coincide with the major urban centers in the United States. On the west coast are Seattle-Tacoma-Washington, the San Francisco Bay area, and Los Angeles, for example.
The chart demonstrates why it isn’t appropriate to think numerically about the country as a whole. Sure, Americans want to know how the U.S. is doing overall. However, when it comes to actual COVID-19 containment and mitigation, it’s a local, regional problem. That’s why our county and municipal health departments are so important and local statistics are the most meaningful and practical.
All is not local, however. The urban centers are connected by highways and air routes, giving SARS-CoV-2 passage. As the disease plays out, the coastal urban centers with the greatest population and density will likely succumb first, followed by so-called second tier cities. When the disease subsides in major urban centers, the second tier will maintain active reservoirs of SARS-CoV-2. If major urban centers drop community mitigation (e.g., social distancing) too soon, the active pools in the second tier will cause COVID-19 flare-ups in any major urban center that drops its mitigration too early.
Major urban centers are more tightly connected to global business and commerce than the second tier. SARS-CoV-2 likely arrived much earlier than the second tier and SARS-CoV-2 has probably been circulating in the first tier population for a longer time.
Italy’s land area is 294,140 sq km (square kilometers), roughly the size of Arizona (294,207 sq km). Italy’s population is estimated to be 62,402,659 people (July 2020). California is the most populous state with 39,512,223 residents (July 2019). Overall, Italy has as many people as California and New York State combined in a smaller land mass (Arizona).
Italy’s Lombardy region is, arguably, the Italian region most severely affected by COVID-19. Lombardy is located in northern Italy with the major urban center Milan as its capital.
Lombardy has 10,078,012 people (August 2019). It is the most populated region in Italy. It’s population is roughly the size of Michigan (or North Carolina, or Georgia). Lombardy, by population, would be the tenth largest state in the U.S. Lombardy is 23,844 sq km, roughly the size of West Virginia. Lombardy has a population density of 420 people per sq km.
The city of Milan has 1.369 million people. (The World Fact Book claims 3.140 million people, but it depends on how one draws boundaries.) Milan has a population density of 7,572 people per sq km (2019). That’s roughly the same density as Huntington Park (Los Angeles metro) or Somerville (Boston metro). New York City has a population density of 10,431 people per sq km. [I taught in Somerville; it’s dense.]
Lombardy accounts for 68% of COVID-19 fatalities in Italy. 23% of Italians are 65 or older, making it the second oldest population in the world. (Japan is first.) Age and underlying health conditions are known COVID-19 vulnerabilities. High population density and more elderly people (with existing health issues) are a fatal combination of factors.
Temperature
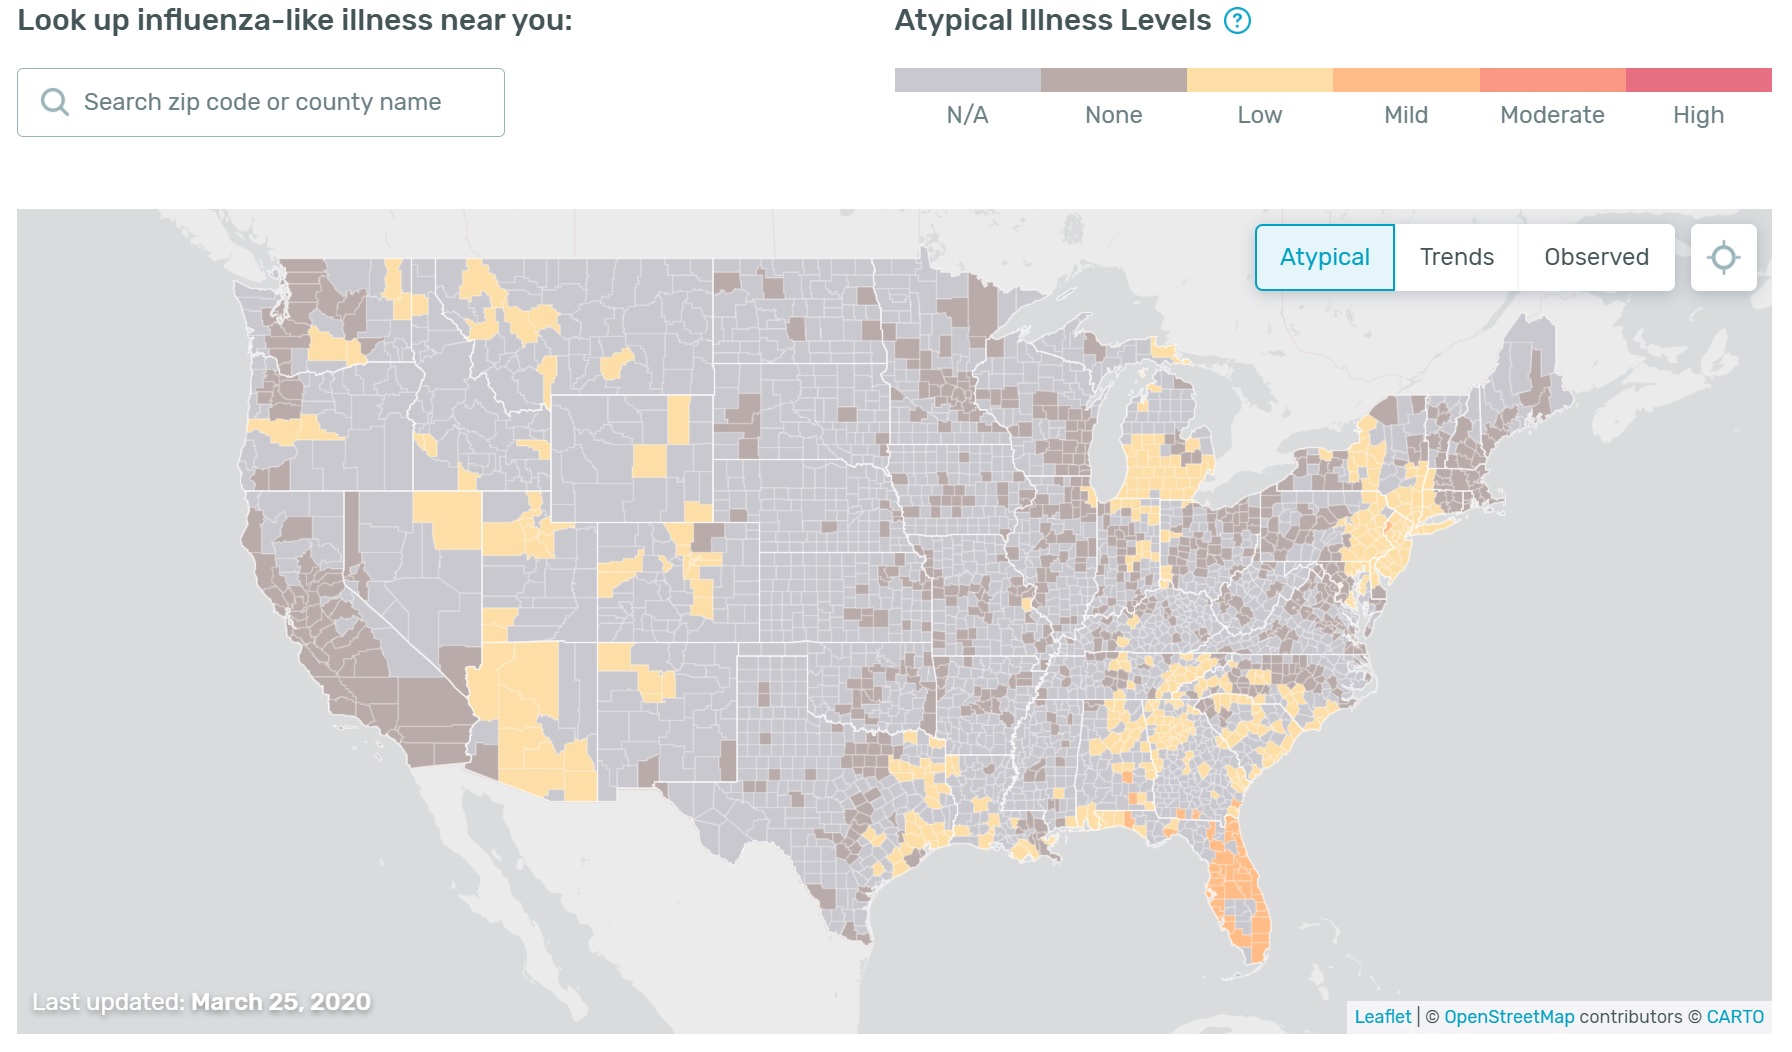
One final observation because it involves maps. The Kinsa US Health Weather Map has received media attention including MSNBC’s The Rachel Maddow Show. (Hi, Rachel.)
The Health Weather Map is a visualization of seasonal illness linked to fever as measured by Kinsa Smart Thermometers. The Kinsa Thermometer connects to your device (and the Kinsa App) via Bluetooth. The Kinsa Thermometer costs about $20-$25 USD retail and requires the Kinsa App for Web communication.
Here is today’s map (March 26). [Click to enlarge.]
Kinsa US Health Weather Map (March 26, 2020)
I look at the Health Weather Map with interest, but take it with a grain of salt. There are two factors to consider.
Although the Kinsa Thermometer is inexpensive, it needs an expensive smart device in order to communicate results via the Web.
It’s not clear how people use the thermometer, i.e., do they take their temperature every day? When they feel sick?
Given the need for a smart device and Internet connection, I’m not sure if Kinsa users represent the population at large. Use of the device may bias results, too. If users take their temperature only when they are sick, then the map will show more high temperatures. Ah, well, I need to dig into their study. [Thank you, Kinsa, for posting your methodology.]
Stay apart, mate, and we’ll both be healthy — P.J. Drongowski
Thank goodness. When I first glanced at the percentage of new positive cases per day (Washington State), I felt optimistic. After reflection, I decided. “Yes, it’s good that the percentage is not increasing rapidly, but even no change is still bad.” Even a constant flow of new patients into the health care system will eventually overwhelm it. A linear curve, as opposed to an exponential curve, merely postpones the day when we exceed capacity.
Someone might say, “Oh, linear isn’t bad.” Yes, it is and here’s why. It’s not like an acute care patient arrives, is given some magic cure and is sent home. Mean duration of hospitalization in Chine was 12.8 days. [Please see “Clinical Characteristics of Coronavirus Disease 2019 in China” in the New England Journal of Medicine.] Even with a so-called linear curve, acute care patients are admitted and stay. Most hospitals are “right sized” during normal times by administrators interested in efficency. So, it doesn’t take long before capacity and staff are exhausted.
China had hospitalization rates ranging from 15% to 20%. In the Chinese epidemic, 41.3% of patients received oxygen therapy and 6.1% received mechanical ventilation.
There is only one advantage to a linear curve vs. exponential — it gives hospitals and other facilities an opportunity to ramp up for the influx of acute care patients. The availability of respirators and ventilators is a critical concern as well as temporary beds and infrastructure for convalescence and recovery.
We need to push the number of new COVID-19 cases downward through social distancing and good hygiene. I’m glad that Governor Inslee has issued a full stay-at-home order. Now, we all need to listen to it and act.
New York City
Governor Cuomo of New York was visibly more alarmed today. I pulled together a quick table of new case and new testing statistics for New York City (NYC).
I’m alarmed, too.
New York City (NYC)
             Cum       New     Cum     New          Percent
Date    Positive  Positive   Tests   Tests  Ratio  Hospital
------  --------  --------  ------  ------  -----  --------
Mar 20      4408      1939   14386    4852  40.0%       18%
Mar 21      6211      1803   19463    5077  35.5%       15%
Mar 22      9045      2832   26389    6927  40.1%       13%
Mar 23     12305      3260   33003    6614  49.3%       13%
Mar 24     14904      2599   38390    5387  48.2%       --
Mar 25     17856      2952   44076    5686  51.9%       12%
Mar 26     21393      3537   51031    6955  50.9%       14%
Mar 27     25398      4005   57954    6923  57.9%       15%
Mar 28     29766      4368   65902    7948  55.0%       --
Mar 29     33768      4002   73104    7202  55.7%       14%
Mar 30     37453      3685      --      --     --       14%

24% of hospitalizations are ICU patients (March 23)
23% of hospitalizations are ICU patients (March 24)
24% of hospitalizations are ICU patients (March 26)
24% of hospitalizations are ICU patients (March 27)
24% of hospitalizations are ICU patients (March 29)
25% of hospitalizations are ICU patients (March 30)
The percentage of new positive cases per day (which takes the ever-varying number of tests into account) for Washington State is around 6.5%. The ratio for New York City is 6 times higher than Washington. (Update: Washington State calls this ratio “Positivity Rate.”)
I fear that NYC is already in the weeds. Folks, NYC is the largest financial center in the United States. So, even if all you care about is money, this is the wrong time to lift restrictions and to restart the American economy. Plain and simple, that’s crazy talk. And, immoral.
Stay distant and stay healthy — P.J. Drongowski
Update quoting CNBC News:
New York and New Jersey are seeing coronavirus attack rates at least five times higher than other parts of the country, a U.S. official in charge of the White House’s pandemic response efforts said Monday.
“The New York metro area of New Jersey, New York City, and parts of Long Island have an attack rate close to one in 1,000,” Dr. Deborah Birx, a physician and the White House coronavirus response coordinator, said at a press briefing Monday evening. The attack rate is the percentage of a population that gets the disease.
She said roughly 28% of the specimens submitted in that region have tested positive for COVID-19, while less than 8% have tested positive for the disease in the rest of the country.
New York is currently the hardest-hit state in the country, ahead of New Jersey, California and Washington state. New York City, alone, accounts for 12,305 of the 20,875 confirmed infections in the state as of Monday morning.
Thanks to The Seattle Times and the Washington State Department of Health (DOH), I have built a table that summarizes COVID-19 case statistics since late February. Data before March 10 is somewhat spotty and lacks the number of tests per day, etc. The raw numbers are shown in the table below.
I have tried to make this table as accurate as possible. Please forgive any transcription errors. The Washington Department of Health has suffered technical issues, so there are gaps in the data. Their database has been overwhelmed and they have had trouble tallying negative test results and the number of tests.
The State DOH reports the cumulative number of positive cases (tests) negative test results daily — the second and third columns in the table. The fourth columb, cumulative number of tests, is the sum of the cumulative positive and negative results each day.
From these numbers, we can compute the number of new positive cases and the number of new tests for each 24 hour period:
    Tests.Today = Positive.Today + Negative.Today
    New cases = Positive.Today - Positive.Yesterday
    New tests = Tests.Today - Tests.Yesterday
    Ratio = (New cases / New Tests) * 100.0
The seventh column, ratio, is the percentage of positive new cases per day. I believe that this percentage is an appropriate measure for tracking COVID-19 over time. The ratio normalizes the number of positive cases for the number of tests performed. Thus, it makes daily results comparable even as our test capacity and number of daily tests grow.
Update: Washington State calls this ratio/percentage “Positivity Rate.”
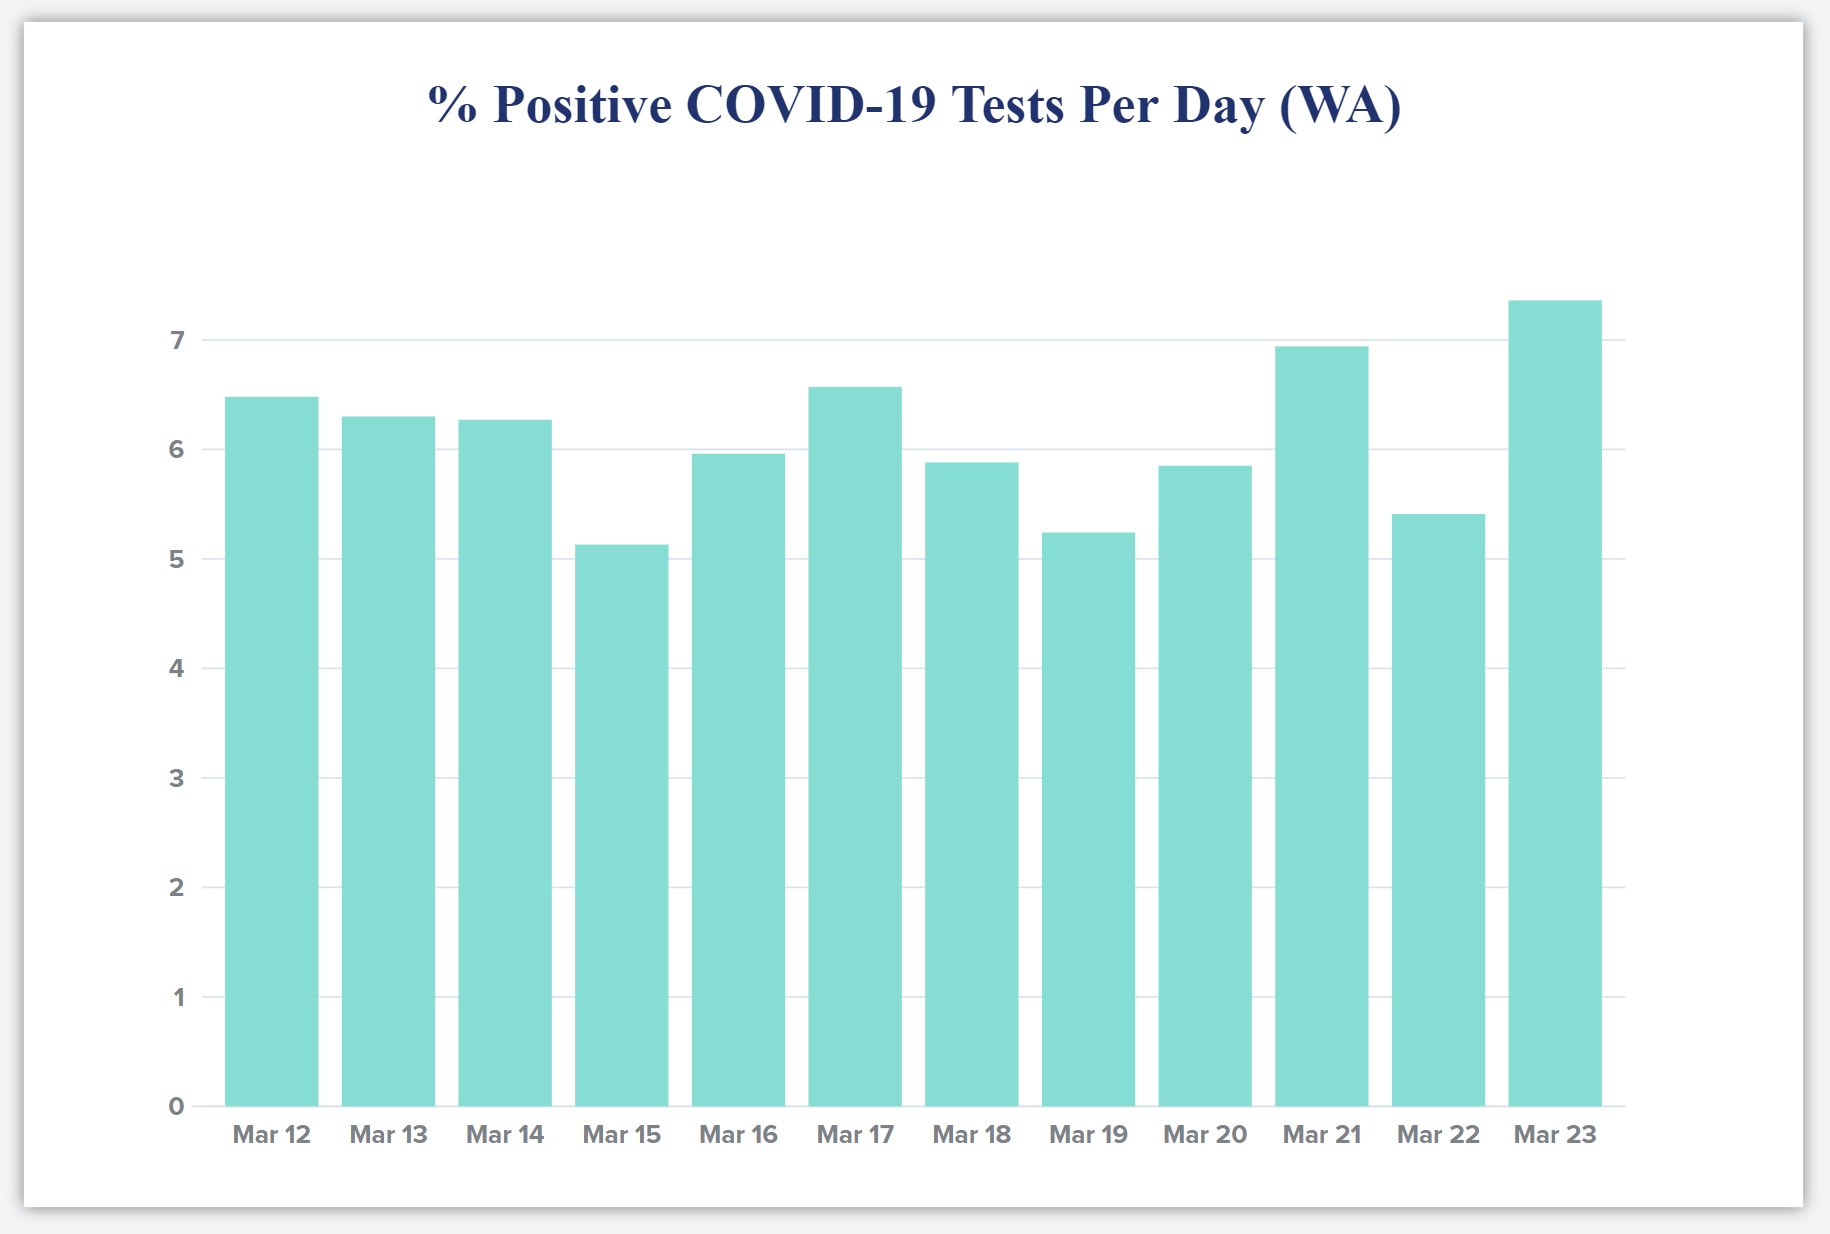
The bar chart below is a quick and dirty plot of the daily percentage of positive cases over the last ten days. Be sure to check the vertical scale when interpreting the chart!
Percentage of positive COVID-19 tests per day (Washington State)
I hope this trend declines. Please remember that any measurements taken today show what COVID-19 was doing 10 to 14 days ago. The delay is due to the time required for COVID-19 incubation, worsening of symptoms, clinical presentation and testing.
The last column in the table, Notes, are my mental notes marking significant events along the COVID-19 timeline in our area. The events are:
Snohomish County (my home) declares a state of emergency.
Vice President Pence visits the State of Washington.
Governor Inslee bans groups of more than 250 people.
The State advises people to stay at home, especially the elderly.
The City of Everett (a stone’s throw away from home) imposes a stay at home order.
Up to today, Governor Inslee has not imposed a blanket “stay at home” order. Suggestions made by the state are similar to a stay at home order, but do not have the force of law.
Don’t do this
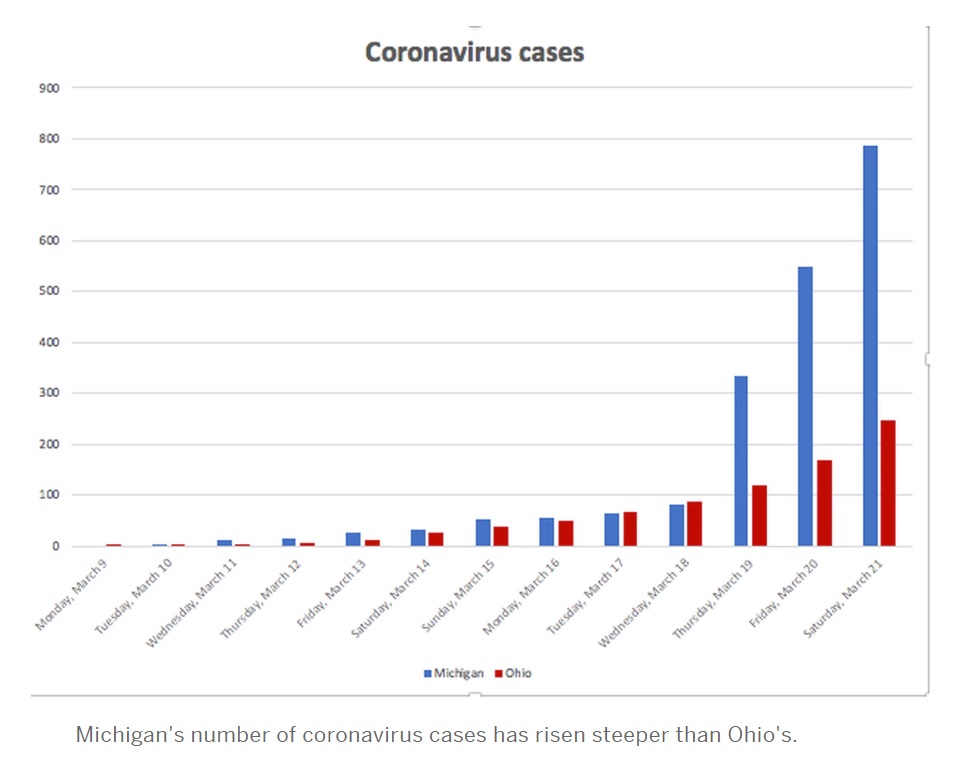
Here is the egregious chart of the day by way of Cleveland.com. I still check in with my original hometown. Hope the Cavs can hit the court again.
To be fair, the author did put a few caveats about number of tests, etc. in the article. The caveats are lost in the TL:DR age. Please don’t publish meaningless charts and comparisons.
If I were teaching a math or science class today, I think I would use this chart in class about critical thinking and interpetation of the graphs thrown at us by the media.
No one (CNN, etc.) should compare state-by-state number at this point in time. There isn’t a standard for reporting and test capacity is, literally, all over the map.
Life has dropped into a bit of a routine. Get up, start the coffee pot and watch the briefing by Andrew Cuomo, Governor of New York. The Guv can be a little tedious and pedantic (well-known characteristics to New Yorkers), but he is a wonderful communicator. First, he speaks slowly and in simple, clear sentences — good for people for which English is not their first language.
He also has been presenting clear statistics on testing and the number of new COVID-19 cases. His interpetation and remarks are correct. The more you test, the more you will find the disease. One of his charts today had three columns: locality (county and entire state), cumulative COVID-19 cases to date and the number of new cases identified for the preceding 24 hour period. At the very least, the Governor needs to add a fourth column, the number of tests performed during the preceding 24 hour period. The fourth column would show the concurrent growth of new cases and tests.
I also heard the Governor struggling, just a bit, to put the number of new cases in context with the growth in testing. [New York has done an excellent job of ramping up its testing, BTW.] That’s where the ratio of new cases to tests comes into play:
Percentage of new positive cases = ((New cases) / (New tests)) * 100
I get that most people do not think in terms of ratios between 0.0 and 1.0, so this measure can and should be expressed as a percentage.
The percentage (ratio) accounts for the growth in testing. I believe that this percentage (ratio) is a better tracking metric than the raw number of new cases alone. It is certainly better than the cumulative number of COVID-19 cases since the beginning of the epidemic. The cumulative number expresses the depth of suffering, but it does not adequately convey the growth or decline of the disease. Given that we will experience recurring waves of COVID-19 (if we suppress this disease successfully), the cumulative number of cases alone will obscure the rise and ebb of COVID-19.
I was encouraged to see New York using a metric similar to my COVID-19 Key Performance Indicator (KPI). New York officials are monitoring the number of all acute care patients. This is the most relevant number with respect to the capacity of the health care system. Please note that acute care includes all of the “every day” acute care patients (heart attacks, strokes, etc.) and COVID-19 patients. All of these patients need to be hospitalized and all of them put a load on the health care system.
If I have to add a public service announcement (PSA) of my own, please don’t drive under the influence and please don’t drive distracted (i.e., texting). Hospital emergency rooms don’t need additional patients. And be careful with that axe, Eugene.
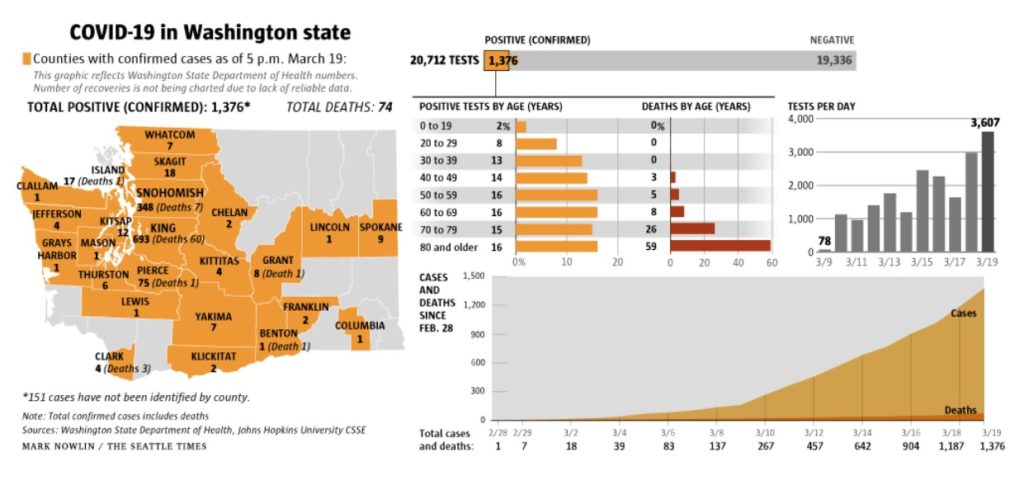
The Seattle Times
I’d like to give a shout-out to my (new) hometown newspaper, The Seattle Times. They publish a concise daily summary of new and cumulative test results (March 19, 2020 below; click to enlarge).
The summary has the daily number of tests performed, positive cases identified and negative cases. Charts break out positive cases and deaths by age. Tests per day has its own chart and shows the growing number of tests. There is a chart showing the cumulative number of positive cases and deaths over time since February 28.
All good work. The raw figures come from the Washington State Department of Health, who should be commended for their transparency.
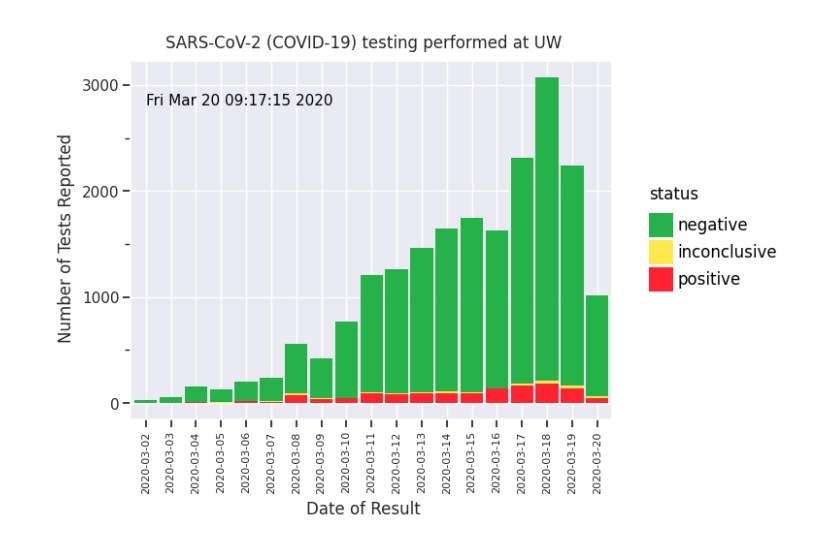
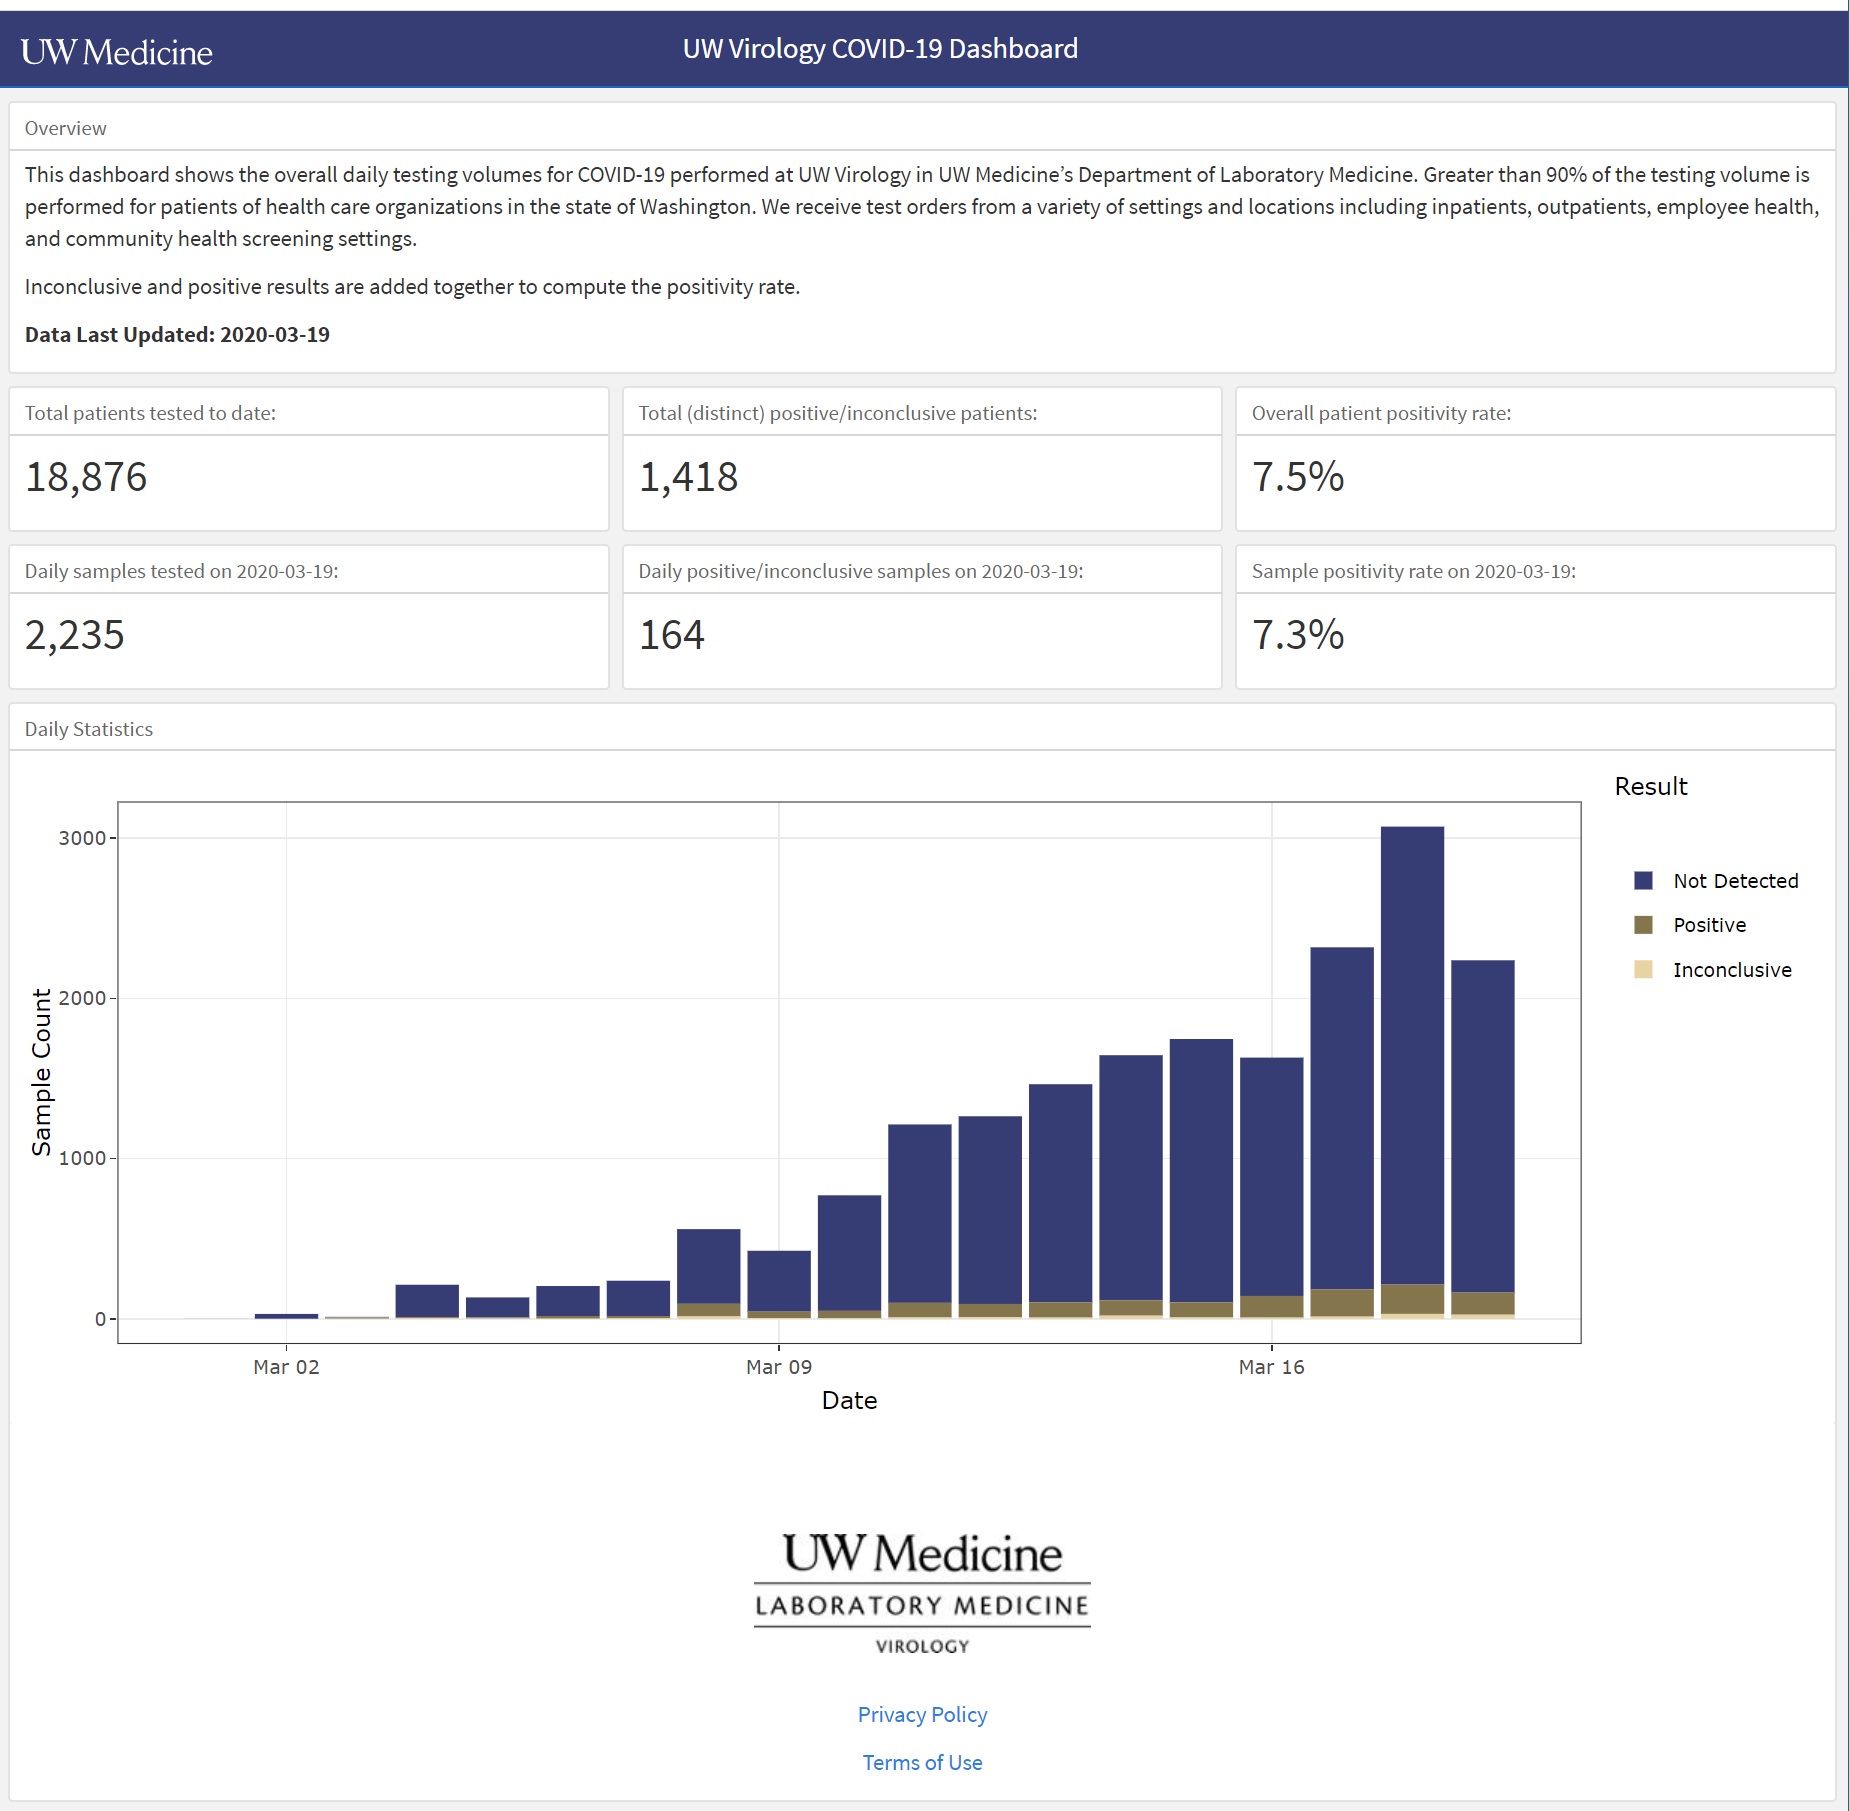
The UW Virology Laboratory upped their game and publish daily results in the UW Virology COVID-19 Dashboard. [Click images to enlarge.]
University of Washing Virology Laboratory COVID-19 Dashboard
This is a screenshot of the dashboard for March 19, 2020. It’s easy to see the number of tests (“Sample Count”) performed each day, the number of positive and negative cases identified, and the number of inconclusive results. You can hover the cursor over a bar segment and get the raw count for the chosen segment.
Very nice work. The trend of positive cases is easy to see. The chart shows the raw number of positive cases, so interpretation is still biased by the number of tests performed. A separate chart is needed which plots the percentage of new positive cases over time.
One additional suggestion for UW Medicine — Please explain “Inconclusive”.
As I mentioned yesterday, each day’s results are a glimpse into the past. COVID-19 has a 2 to 14 day incubation period according to the CDC. Other medical experts estimate the infection to test delay at 10 to 14 days (infection, incubation, symptoms, clinical presentation, test). Even though the trend of new COVID-19 cases is relatively flat, we won’t really know for another 14 to 21 days if we successfully flattened the curve and delayed onset of the disease in the community.
On March 16, President Trump warned that the COVID-19 outbreak could last until July or August 2020. This was the first official recognition that the outbreak could take months to quell, not a few weeks. On March 18, The New York Times and other media outlets published the U.S. Government COVID-19 Response Plan. The plan states that a moderately severe outbreak could last 12 to 18 months with multiple “waves.”
The duration and potential number of waves may shock some. However, the timing and waves of resurgence/subsidence are fairly typical for epidemics and other phenomena in nature. Consider, for example, predator-prey population models. Predators thrive and reproduce when prey are plentiful. When the food supply dwindles, predators die off and the predator population dwindles. With fewer predators, prey survive and multiply. The cycle of growth and decline repeats.
Viruses need susceptible, infectable hosts in order to reproduce. Thanks to bodily immunilogical response, human hosts may develop an immunity as a result of infection and recovery. Immunity may be limited to the specific infecting strain of the virus. Unfortunately, viruses are adaptable and a strain may mutate into a new different strain which is not suppressed by immunity to the original strain.
The specific behavior of SARS-CoV-2 — the virus which causes the disease COVID-10 — is not fully known, including human immunilogical response to SARS-CoV-2. Citing Dr. Anthony Fauci, no scientific study to date has demonstrated acquired immunity to SARS-CoV-2. Dr. Fauci and other experts believe that acquired immunity is likely.
Timeline
The U.S. Government COVID-19 Response Plan states, “Late December 2019, authorities from the People’s Republic of China (PRC) announced a possible epidemic of pneumonia of unknown etiology centralized on a local large seafood and live animal market in Wuhan, China. Estimated case onset was early December.”
Given the lack of Chinese transparency, slow governmental response and the speed/extent of modern jet travel, the SARS-CoV-2 virus has probably been circulating in Snohomish and King County Washington for quite some time. The report states, “The first U.S. case of COVID-19 was confirmed in Washington State on January 20 and was travel-related.” This patient landed from Wuhan, China on January 15 without symptoms and eventually presented on January 19 with symptoms of pneumonia.
The first case of community spread in the U.S. (California) was confirmed by the CDC on February 26, 2020. The first case of community spread in Snohomish County, WA was confirmed on February 28. Thus, SARS-CoV-2 circulated in the Snohomish and King County area for nearly six weeks. Detection of community spread is a red flag for a developing epidemic.
On March 9, the Washington Department of Health confirmed 162 total cases including 22 deaths. Most of these deaths occurred at Life Care Center of Kirkland, a nursing home linked to at least 54 confirmed cases as of March 9. King and Snohomish Counties had 116 and 37 total cases, respectively, as of March 9. If you are interested in the details, the March 18, 2020 CDC MMWR is short and to the point.
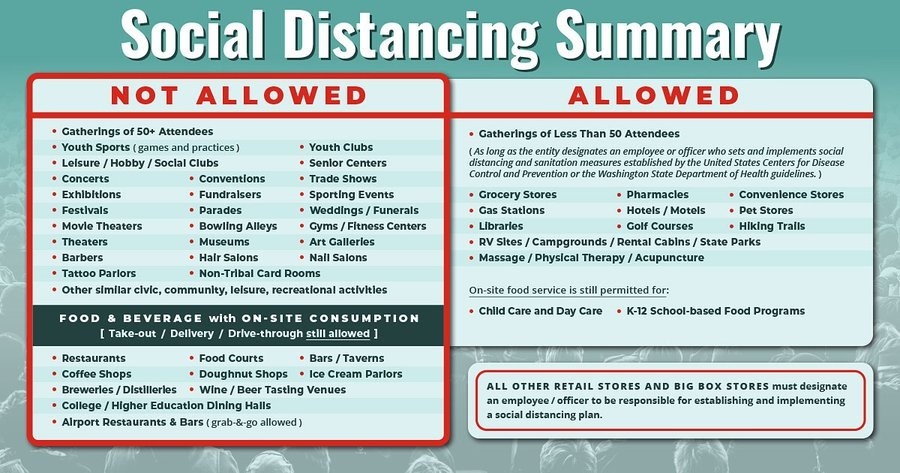
Washington State immediately announced and slowly ramped up community mitigation. Governor Inslee issued the most stringent order on March 16. As of today, March 20, the state government has not issued a “stay/shelter at home” order like California.
State of Washington Social Distancing Summary
Washington’s new cases
The timeline is important in understanding current new case data and in knowing what to look for in the coming two to three weeks.
UW Virology COVID-19 test results (March 20, 2020)
On a positive note (literally), the number of new COVID-19 cases detected by UW Virology is relatively flat. We are now 5 days into the most stringent social distancing rules and practices (March 20).
Although the results are promising, this is not the time to let up.
This graph is a snapshot of the past. According to the CDC, “The following symptoms may appear 2 to 14 days after exposure: fever, cough, shortness of breath.” COVID-19 tests are (effectively) rationed. A patient must meet testing criteria such as COVID-19 symptoms, contact with a known COVID-19 case, or travel from a COVID-19 hot-spot. Thus, the graph shows cases that are 2 to 14 days after infection.
Social distancing in Washington State did not “get serious” until March 16. The next three weeks (21 days) will tell us if social distancing in Washington State has really been effective in slowing the spread of COVID-19.
The curves (again)
Quoting the San Francisco Chronicle, “More than half of Californians could be infected with the new coronavirus over an eight-week period if nothing is done to stop it, according to a projection from Gov. Gavin Newsom’s office.”
Let’s hope this statement motivates California’s to adopt social distancing, hygiene and other measures suggested by health autorities.
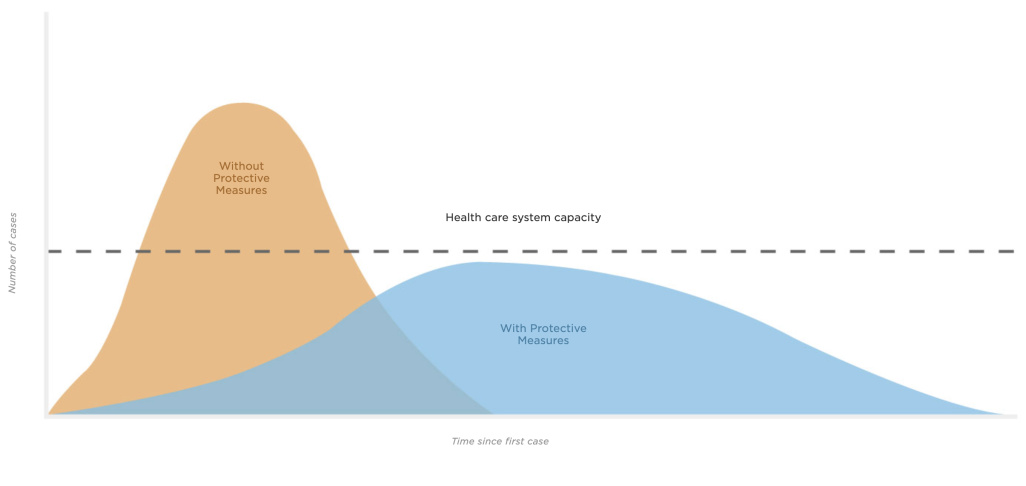
Gov. Newsome is referring, of course to the orange curve in the now well-known CDC “flattening the curve” chart. If Californians (or the citizens of any other region or city) do not practice social distancing, then new cases will grow exponentially and hospitals, doctors and nurses will be overwhelmed.
Epidemiologists have studied disease for a very long time. And, like any other science, they have built mathematical models to predict the growth and decline of epidemics. The SIR model (Susceptible, Infectious, Recovered model) is one of the simplest — and classic — models. Typically, these models are driven by parameters such as the reproduction number, R0, pronounced “R naught”. R0 is the average number of people who catch the disease from one contagious person.
If R0 is less than one, then the disease will die out.
If R0 is one, the disease remains alive, but does not break out into an epidemic.
If R0 is greater than one, then the disease will spread, possibly growing into an epidemic.
The epidemiologists advising Gov. Newsome have plugged different values of parameters like R0 into their models, run the simulation and assessed the resulting statistics.
“Flattening the curve” essentially means reducing R0 as much as possible.
Here’s the rub which may have escaped some folks. The same number of people will catch the disease (COVID-19) in both the orange unmitigated scenario and the blue mitigated (social distancing) scenario. For the mathematically inclined, the area under the orange curve is equal to the area under the blue curve. The onset of the disease is delayed for some people in order to reduce the strain on the health care system.
The long haul
I started this blog post with statements that more realistically indicate the duration of our battle with COVID-19.
Ideally, we could like to control the growth of COVID-19 (the ramp up) and then stomp it out of existence (the ramp down). Unfortunately, real-world systems tend to behave more like the predator/prey model.
Viruses are opportunistic and adaptible. As long as SARS-CoV-2 circulates in the community, it will find susceptible individuals and infect them. Therefore, as soon as we reduce or abandon social distancing, COVID-19 will have a resurgence. The community will always be in danger of a resurgence as long as SARS-CoV-2 can find enough susceptible people to infect and thrive.
In the opinion of many health experts, our bodies likely acquire an immunity to SARS-CoV-2 as we fight and recover from the disease. At some point, when the so-called “herd immunity” is high enough, the disease will have trouble sustaining itself. We also anticipate a vaccination program against SARS-CoV-2 which will add to the herd immunity. [Yeah, no one likes to be thought of as a “herd”.]
Viruses are composed of proteins and nucleic acid. Without deep-diving molecular biology, viruses contain a form of genetic material: RNA, DNA or possibly both. Viruses usually depend upon a host cell for replication. Short story: viruses can steal genetic material anywhere in this process and mutate. Some mutations are bad and the mutants die out. Some mutations are good and the mutants thrive. That’s adaptation, that’s evolution.
SARS-CoV-2 could mutate. The mutated strain could thrive and grow because acquired immunity and/or the vaccine are specific to the original SARS-CoV-2 strain. Mutation could bring about a resurgence of COVID-19 although the underlying pathogen would be genetically different.
Realistically, it will be difficult to maintain stringent social distancing. We want to be together socially and we will definitely want to get our economy back to full strength, too. In the long haul, we should expect to see cycles of COVID-19 resurgence and decline. We may need to re-impose social distancing to keep COVID-19 in check.
The United States continues to struggle with COVID-19 testing. Communities do not have sufficient COVID-19 test kits and they are, effectively, rationing tests. Generally, a patient must satisfy several criteria before a COVID-19 test is authorized and performed. Example criteria include cough, fever (high temperature), shortness of breadth, exposure to an infected individual, or travel to a known COVID-19 hot-spot. A patient may be tested first for influenza, receiving a COVID-19 test after influenza is ruled out, i.e., the patient fails the flu test.
Even in the face of shortage, the number of COVID-19 tests performed each day is steadily increasing albeit slowly.
With the current situation in mind, let’s look at few metrics.
Media reports
The most frequently reported statistics are the cumulative number of confirmed COVID-19 cases and the number of deaths due to coronavirus. A few news organizations report the number of new confirmed cases for the preceeding 24 hour period (AKA “per day”).
Most numerate people realize that “If you test, you will find the disease.” If you test more, then the raw number of confirmed cases will also rise.
Very few news organizations report the total number of tests performed per day as well as the number of new confirmed cases per day. Lacking the number of tests performed for each day, one cannot put the number of new confirmed cases in context. Nor can an investigator determine a trend over time, i.e., , is community mitigation (e.g., social distancing, etc.) controlling the spread of COVID-19?
We should insist on receiving three per-day metrics: the number of tests performed that day, the number of new confirmed cases and the number of negative cases. The number of tests performed will tell us if COVID-19 test capacity has improved or not. Then, I recommend computing, tracking and comparing the ratio of new per-day COVID-19 cases (confirmed positives) divided by the number of tests performed that day. The ratio better indicates the growth (or decline) of the disease in the community.
The Washington State Department of Health does report a daily break down. Their page breaks out confirmed cases by county, by age and by sex. The Department of Health also provides testing information. Unfortunately, the number of individuals tested, positive and negative are cumulative. As of March 17, the test figures are:
Positive: 1,012
Negative: 13,117
Individuals tested: 14,129 (Positive+Negative)
Percent positive: 1,012 / 14,129 = 7.7%
Please give us nonaggregated results for each day!
Beware sampling bias
One might be inclined to interpret the daily percentage of new confirmed cases as the rate of incidence of the disease in the community (the population at large). Unfortunately, the pre-testing criteria guarantee a biased sample. We are testing patients for COVID-19 only if they have symptoms, have a certain risk factor and/or do not have the flu. The ratio may overstate the incidence of disease or, worse, understate the incidence by missing asymptomatic, infected individuals.
The lack of COVID-19 test capacity leaves public health officials in a terrible bind. One would like to randomly sample (test) the population at large in order to estimate the number of infected people (symptomatic and asymptomatic) in the community. This is akin to taking a political poll. We need to select randomly (say, 1,600 people) from the community and test the selected individuals for COVID-19. We estimate the total number of infected people by multiplying the proportion of infected people as measured by sampling (“the poll”) times the overall population size.
One needs the right kind of test, of course. We want to measure current, active infections, not past infections that have resolved (recovered). This leads us (almost) to the classic SIR model (susceptible, infected, recovered) for epidemics — yet another topic! Also, time to ask the Google about “real-time reverse transcription – polymerase chain reaction (RT-PCR)” and COVID-19 testing. Who said self-isolation was uninteresting? 🙂
From statistics theory, 1,600 tests has a margin of error of plus/minus 2.45%. 1,600 tests is a modest number and, unfortunately, we can barely perform medical diagnostic testing let alone conduct a necessary statistical study at this time. Ideally, we would have sufficient capacity to conduct “tracking polls” to determine the overall trend, i.e., are there more (or less) infected people today than last week? Our officials are truly flying blind at the worst possible time.
Recent studies suggest that asymptomatic people are a significant source of new infections. That’s why public health officials are saying, “Act and behave as though you are infected.” We need tests. We need tools.