Time for what’s known in the journalism biz as a “round-up.”
I started blogging about COVID-19 numeracy (AKA “by the numbers”) as a way to get my head around all of the data thrown at us by media outlets. Blogging also gave me a way to have the illusion of control over that which I cannot control, namely, the spread of COVID-19.
I hope that my blog posts are a resource for math and science teachers. (I try to keep these posts free of politics, BTW.) If there is a silver lining in all of this, what an opportune time to teach critical thinking and numeracy! I tried to collect the best and most useful examples of data presentation and, I collected a few stinkers, too.
So, here they are, links to my blog posts about COVID-19 numeracy:
- Washington State, April 6, 2020 (4/7/2020)
- Seattle Scene (3/30/2020)
- Epidemiologic Testing (3/27/2020)
- NYT models and cases (3/26/2020)
- Geography including facts about Italy (3/25/2020)
- New York City positivity rate (3/24/2020)
- Washington State positivity rate (3/23/2020)
- Washington and Seattle useful charts (3/21/2020)
- Affect of time on analysis (3/20/2020)
- Testing and bias (3/19/2020)
- Comment on NYT curve flattening by country (3/19/2020)
- COVID-19 key performance indicator: Acute cases KPI (3/18/2020)
If you’re a regular reader, you know that I usually deep-dive music technology and electronics. Fear not, I have been plugging away on music projects, too: Blokas MidiBoy, Toontrack EZKeys, recording demos with Genos, and more. All the projects for which I didn’t have time. Guess I’ve got the time now, just like everyone else. 🙂
I hope to blog about music-related topics as I’m not sure how much value I can add to the on-going COVID-19 discussion. I will continue to track the positivity rate for Washington State since this is my home with family and friends nearby. Plus, there are always subjects (e.g., reverse transcription polymerase chain reaction/RT-PCR testing) that pique my scientific interest.
Washington Post: Bending the curve
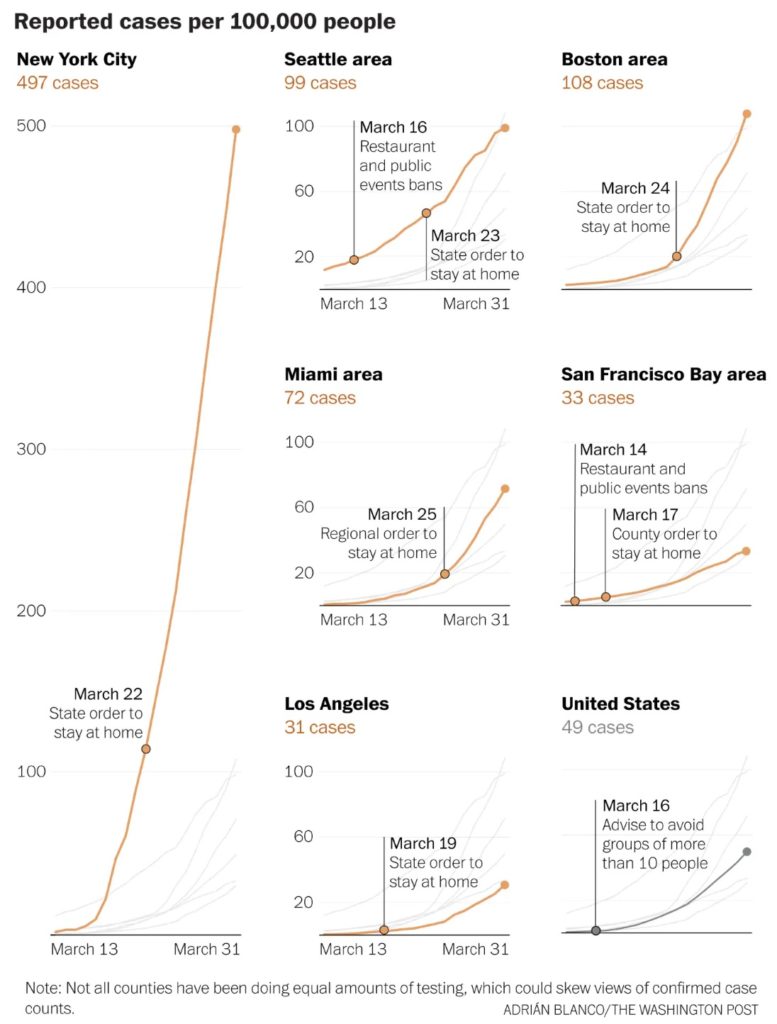
Here’s a quick hit from the Washington Post. It’s a set of graphs illustrating the effect of social distancing for select U.S. cities.

With respect to Washington State (Seattle), it’s still early days, really. I think my original guidance holds — we won’t really see a bend from another 7 to 14 days out from this point (April 2). Washington State imposed its first social distancing on March 16 followed by a stay-at-home order on March 23. With the delay due to SARS-CoV-2 incubation, development of symptoms, clinical presentation and testing (10 to 14 days according to medical experts), we should just now be seeing a bend in the curve.
The Washington State Department of Health (WADOH) has had technical issues with its disease reporting database. The original database could not handle the incoming stream of reports including negative test reports. So, the WADOH database went dark for a few days recently and is just now coming back. Due to these technical glitches, we need a little extra time to see the effect of social distancing in Washington.
Stay apart and keep all of us healthy — P.J. Drongowski
