Current situation: 18 March 2020
The United States continues to struggle with COVID-19 testing. Communities do not have sufficient COVID-19 test kits and they are, effectively, rationing tests. Generally, a patient must satisfy several criteria before a COVID-19 test is authorized and performed. Example criteria include cough, fever (high temperature), shortness of breadth, exposure to an infected individual, or travel to a known COVID-19 hot-spot. A patient may be tested first for influenza, receiving a COVID-19 test after influenza is ruled out, i.e., the patient fails the flu test.
Even in the face of shortage, the number of COVID-19 tests performed each day is steadily increasing albeit slowly.
With the current situation in mind, let’s look at few metrics.
Media reports
The most frequently reported statistics are the cumulative number of confirmed COVID-19 cases and the number of deaths due to coronavirus. A few news organizations report the number of new confirmed cases for the preceeding 24 hour period (AKA “per day”).
Most numerate people realize that “If you test, you will find the disease.” If you test more, then the raw number of confirmed cases will also rise.
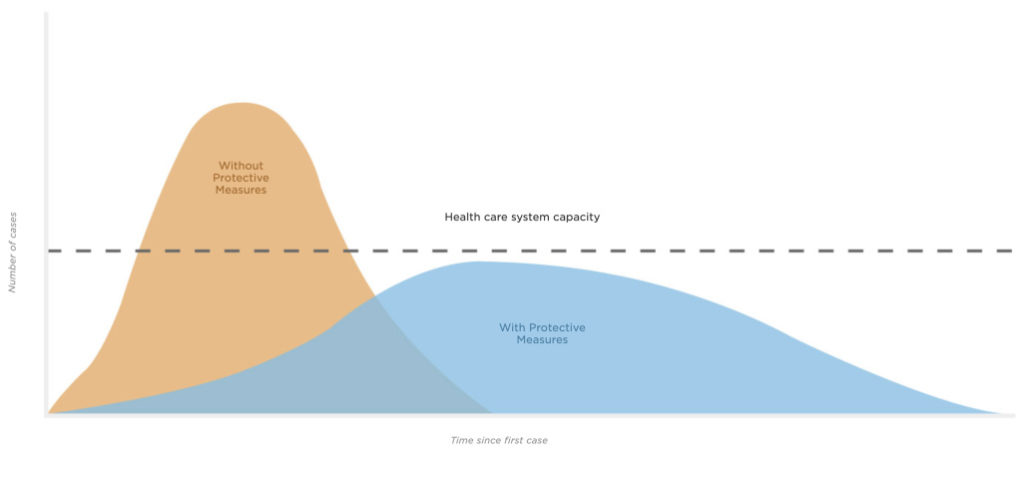
Very few news organizations report the total number of tests performed per day as well as the number of new confirmed cases per day. Lacking the number of tests performed for each day, one cannot put the number of new confirmed cases in context. Nor can an investigator determine a trend over time, i.e., , is community mitigation (e.g., social distancing, etc.) controlling the spread of COVID-19?
We should insist on receiving three per-day metrics: the number of tests performed that day, the number of new confirmed cases and the number of negative cases. The number of tests performed will tell us if COVID-19 test capacity has improved or not. Then, I recommend computing, tracking and comparing the ratio of new per-day COVID-19 cases (confirmed positives) divided by the number of tests performed that day. The ratio better indicates the growth (or decline) of the disease in the community.
The Washington State Department of Health does report a daily break down. Their page breaks out confirmed cases by county, by age and by sex. The Department of Health also provides testing information. Unfortunately, the number of individuals tested, positive and negative are cumulative. As of March 17, the test figures are:
- Positive: 1,012
- Negative: 13,117
- Individuals tested: 14,129 (Positive+Negative)
- Percent positive: 1,012 / 14,129 = 7.7%
Please give us nonaggregated results for each day!
Beware sampling bias
One might be inclined to interpret the daily percentage of new confirmed cases as the rate of incidence of the disease in the community (the population at large). Unfortunately, the pre-testing criteria guarantee a biased sample. We are testing patients for COVID-19 only if they have symptoms, have a certain risk factor and/or do not have the flu. The ratio may overstate the incidence of disease or, worse, understate the incidence by missing asymptomatic, infected individuals.
The lack of COVID-19 test capacity leaves public health officials in a terrible bind. One would like to randomly sample (test) the population at large in order to estimate the number of infected people (symptomatic and asymptomatic) in the community. This is akin to taking a political poll. We need to select randomly (say, 1,600 people) from the community and test the selected individuals for COVID-19. We estimate the total number of infected people by multiplying the proportion of infected people as measured by sampling (“the poll”) times the overall population size.
One needs the right kind of test, of course. We want to measure current, active infections, not past infections that have resolved (recovered). This leads us (almost) to the classic SIR model (susceptible, infected, recovered) for epidemics — yet another topic! Also, time to ask the Google about “real-time reverse transcription – polymerase chain reaction (RT-PCR)” and COVID-19 testing. Who said self-isolation was uninteresting? 🙂
From statistics theory, 1,600 tests has a margin of error of plus/minus 2.45%. 1,600 tests is a modest number and, unfortunately, we can barely perform medical diagnostic testing let alone conduct a necessary statistical study at this time. Ideally, we would have sufficient capacity to conduct “tracking polls” to determine the overall trend, i.e., are there more (or less) infected people today than last week? Our officials are truly flying blind at the worst possible time.
Recent studies suggest that asymptomatic people are a significant source of new infections. That’s why public health officials are saying, “Act and behave as though you are infected.” We need tests. We need tools.
Stay apart and say healthy — P.J. Drongowski


