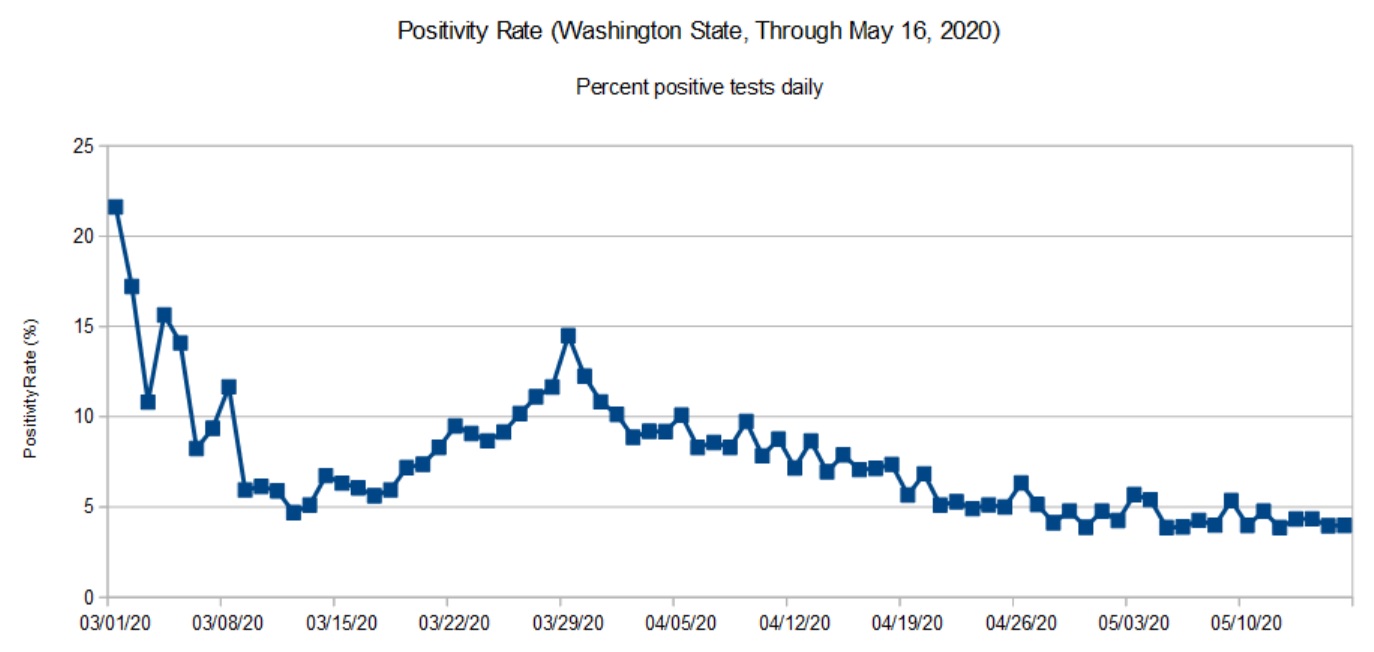
As noted in previous posts, data from the Washington State Department of Health (DOH) lags a little bit as reports arrive from county health departments. So, the DOH chart (below) covers the period up to May 16 (about ten days ago at the time of this writing).
Washington State daily positivity rate (DOH, May 16, 2020)
The trend in the DOH daily positivity rate (percent positive tests per day) is decidedly downward. It’s worth noting, however, how fast a community can move up the curve than down. The difference between the upward slope and downward slope should make people cautious — we don’t want to be on the wrong side of the curve again. It’s better to knock the disease to its knees and keep it there than to suffer a series of waves, even small waves.
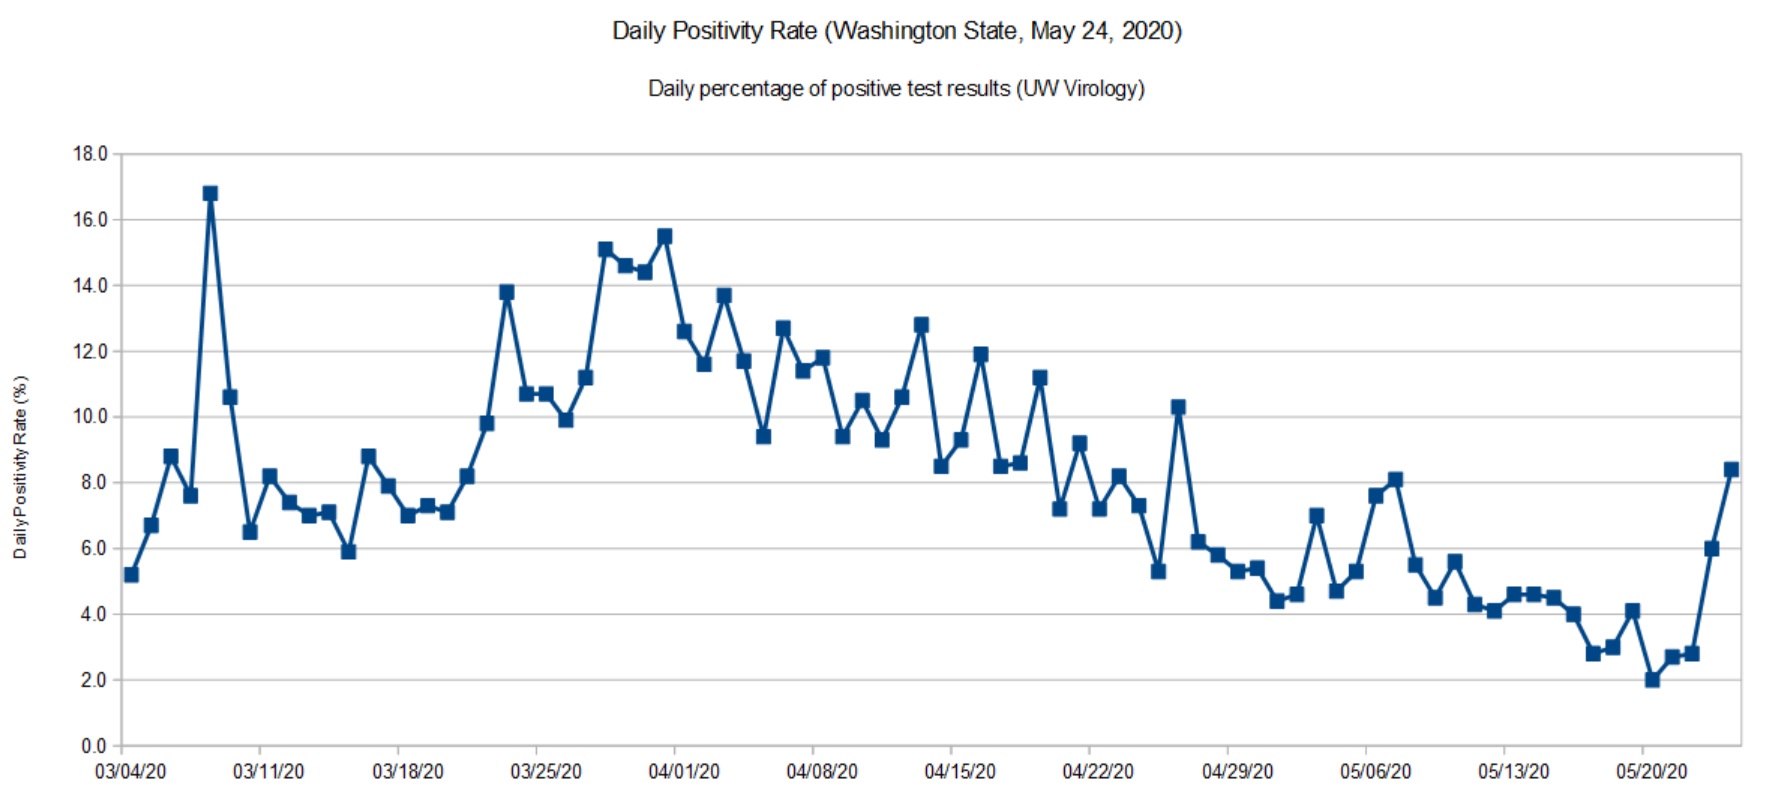
Washington State daily positivity rate (UW, May 24, 2020)
I don’t see a similar up-turn in the latest daily stats from the DOH, so I’m quite curious as to the cause for a higher positivity rate in UW’s most recent data. Did the lab test more samples from a COVID-19 cluster under investigation? Are there quality issues with the samples or test materials? I hope that they are looking into these questions.
I recommend reading this excellent report from the Imperial College COVID-19 Response Team: H Juliette Unwin, Swapnil Mishra, Valerie C Bradley et al. State-level tracking of COVID-19 in the United States (21-05-2020), doi: https://doi.org/10.25561/79231
The report provides a timely analysis and summary of COVID-19 in the United States, including an estimate of the effective transmission rate (Re) for each state. The report is licensed under a Creative Commons Attribution NonCommercial NoDerivatives 4.0 International License.
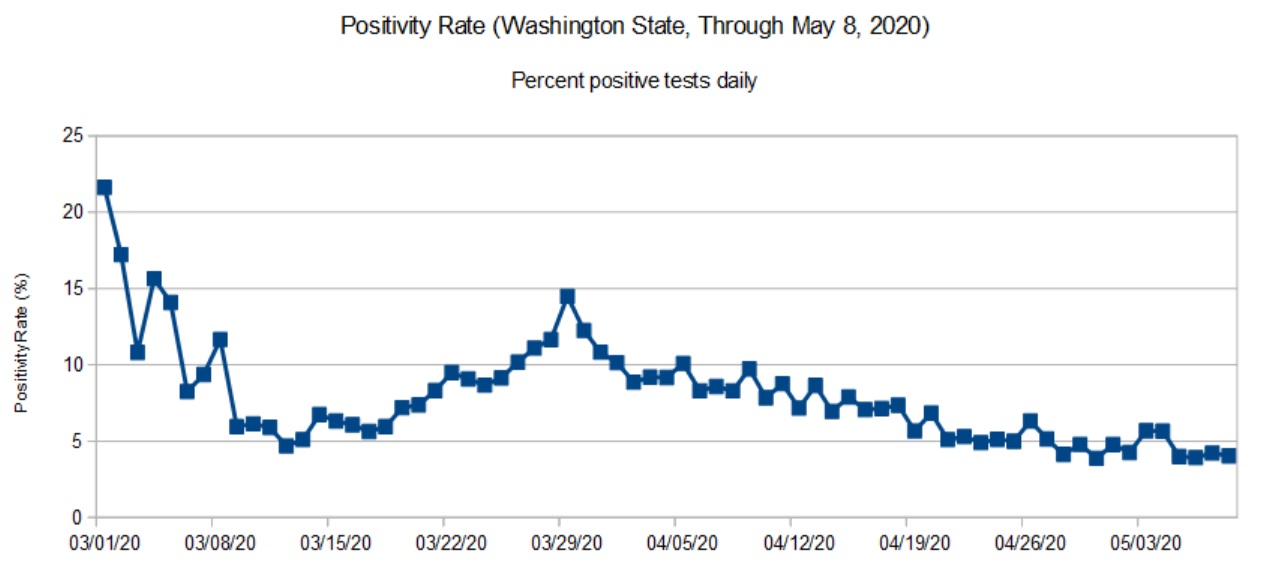
Daily positivity rate for Washington State (DOH, May 8, 2020)
The DOH reports (relatively) complete data through May 8. That’s why the title of this page refers to “May 8” even though I’m posting these charts on May 18.
The UW Virology Laboratory performs a significant portion (about 40%) of the COVID-19 testing in Washington State. Approximately 90% of the tests performed by UW are for patients in Washington itself. [Click images to enlarge.]
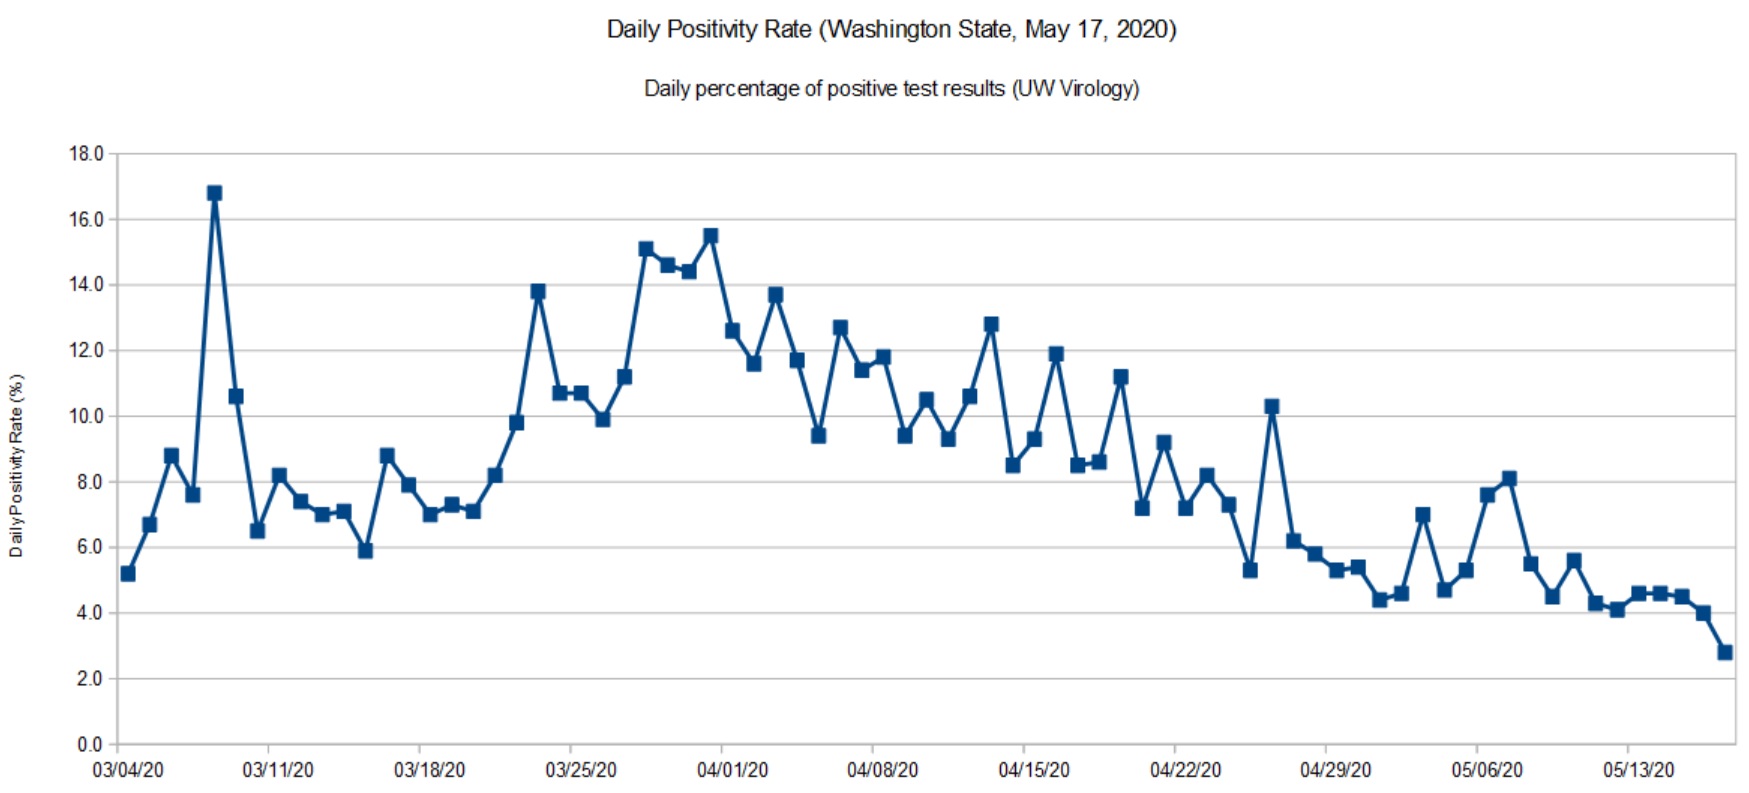
Daily positivity rate for Washington (UW, May 17, 2020)
The UW data is current up to the present date (May 17, 2020). So, you may think about UW’s positivity rate as a glimpse at the past week before the DOH statistics roll out. Like the DOH trend, there was a slight up-tick at the end of April and beginning of May, which is now settling back down.
I’m quite happy to see the downward trend and that we are keeping the disease in check. We are going to the dentist tomorrow (!) and it will be interesting to see how they handle the situation.
The virus is still out there. The CDC MMWR should make everyone wonder about choir/music rehearsals and performance in the near- to medium-term future. We need to take this health threat seriously until people are vaccinated.
After making slow progress against COVID-19, Washington State lost a little ground during the last two weeks. We aren’t heading up the steep slope, but the unusually good weather has brought people out of isolation.
Here we see a more definite up-tick in recent days. As a state, we need to double-down on social distancing — it’s too soon to give up! I don’t think anyone really wants to go through another long lock-down. It’s better to quash COVID-19 and keep it down. Anything less delays economic recovery.
The Institute for Disease Modeling (IDM) estimates the effective reproductive number (Re) for King County, Washington. King County is the most populous county in Washington covering much of the Seattle metropolitan area. (Snohomish County fringes on the metro area, it’s main population center is Everett.)
IDM reports both a likely range for Re (95% confidence interval) and a best estimate for its value on a particular date. The table below summarizes their findings:
    Date            Lower  Upper  Best Est
    --------------  -----  -----  --------
    March 25, 2020   0.30   1.20      0.73
    April 4, 2020    0.55   1.33      0.94
    April 15, 2020   0.28   1.00      0.64
    April 27, 2020   0.47   1.32      0.89
IDM base their analysis on data from the Washington Department of Health and mobility (traffic) data. IDM’s best estimate of cumulative incidence through April 20 is 2.1%, meaning that 2.1% of the community has or has had COVID-19 as of April 20.
Worrisome, IDM hasn’t found Re to have dropped definitively below one for Eastern Washington. Although Western Washington has made progress, Eastern Washington is not improving. The number of new cases tracks Re. When Re increases, the number of new cases increases, too, lagging in time by the COVID-19 incubation period.
Please remember that we are shooting for an Re less than one, meaning that the spread of SARS-CoV-2 (the virus which causes COVID-19) is slow enough to prevent a rapid rise in new cases. Social distancing, contact tracing and isolation are all about keeping Re as far below one as possible.
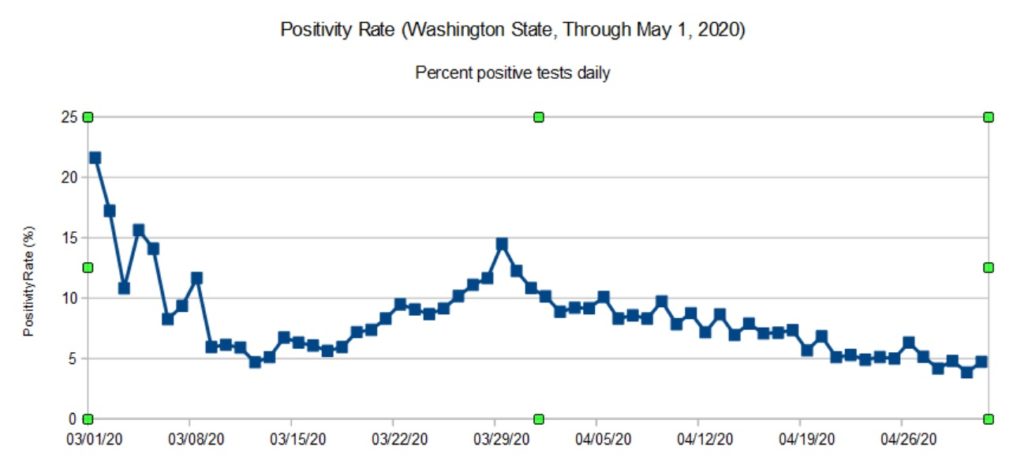
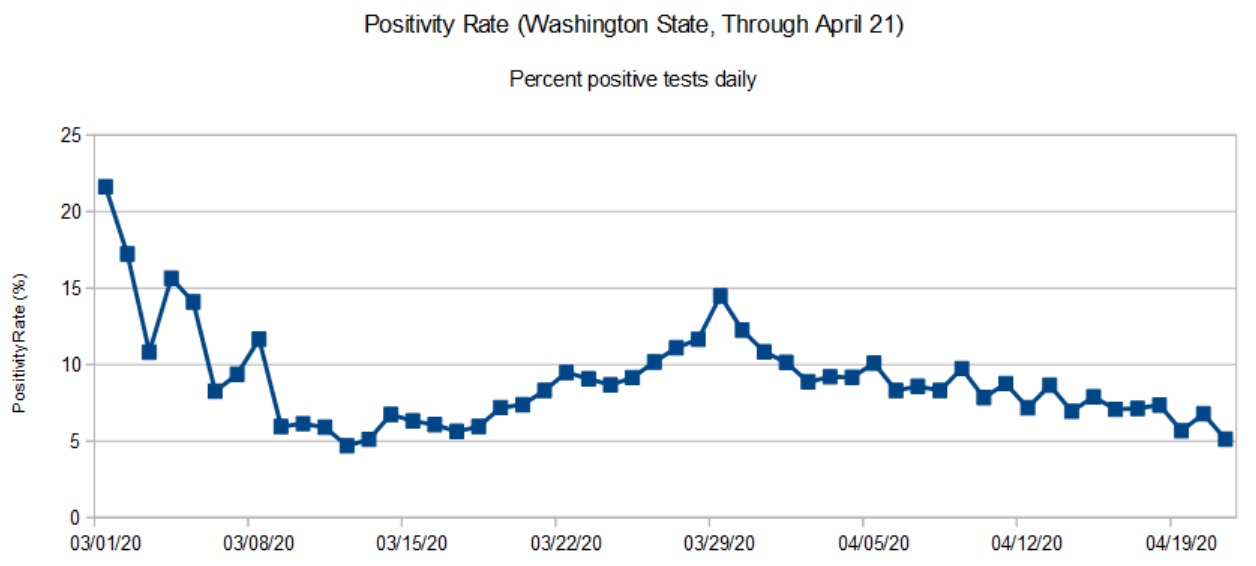
To kick things off, here are my latest graphs for the Washington State COVID-19 positivity rate. The positivity rate is the daily percentage of positive COVID-19 tests. Like the daily new case count, we’re hoping to see a downward trend over time as community mitigation (AKA “social distancing”) slows the effective infectiousness (REFF) of SARS-CoV-2.
Washington State daily positivity rate (DOH, April 21, 2020)
The first graph is based on data from the Washington State Department of Health (DOH). DOH aggregates data across the entire state. Data for most recent days are incomplete and I have not included partial results in the graph.
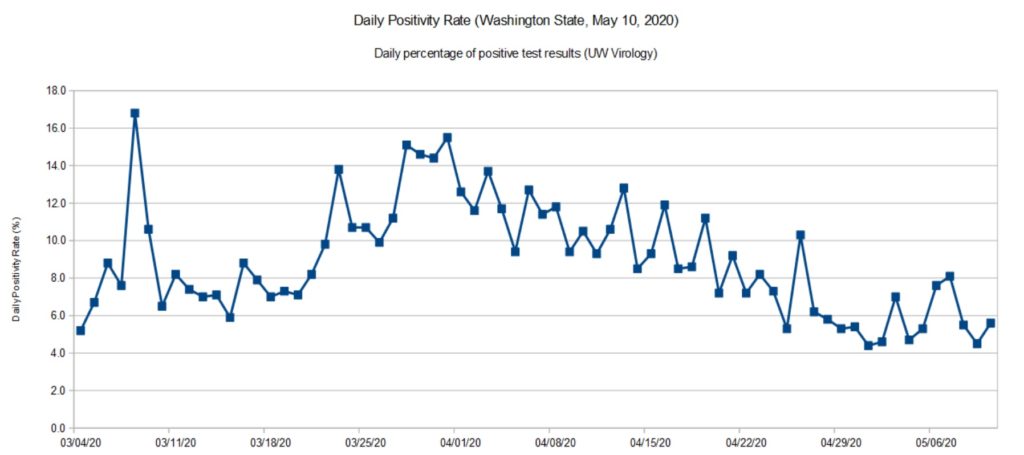
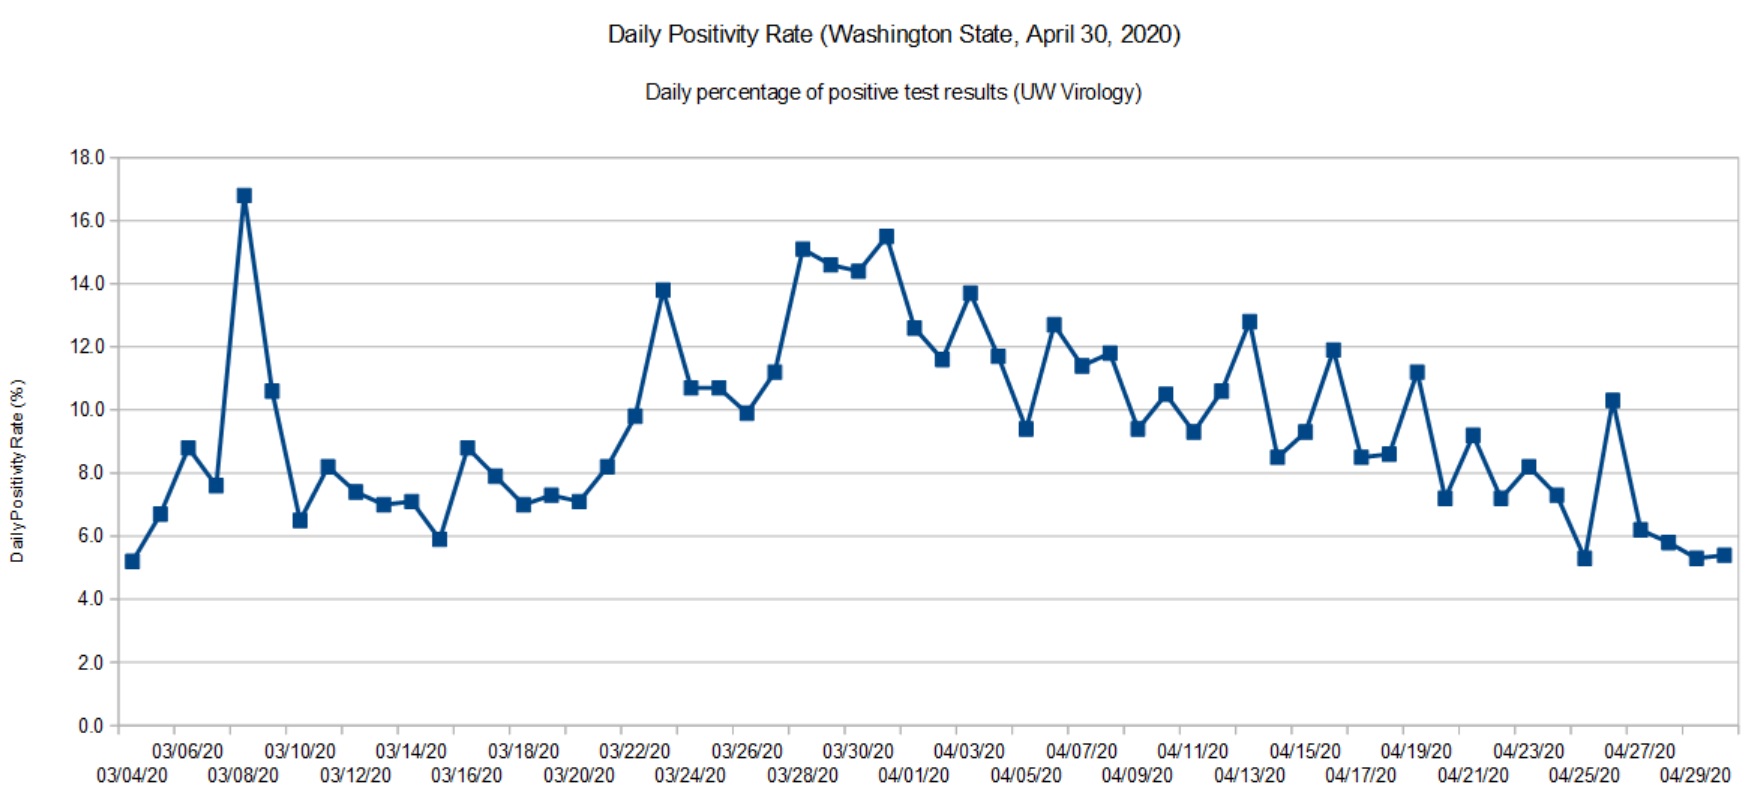
Washington State daily positivity rate (UW Virology, April 30, 2020)
The second graph is based on data for the University of Washington (UW) Virology Laboratory. The UW chart is up-to-date because they don’t have the same aggregation and reporting responsibility as DOH. For UW, it’s specimens in, and test results out. The UW results are sent to DOH where they are eventually folded in.
Both graphs show a steady decline. In terms of positivity rate, we’re back to where we were in mid-March. The peak occurred around March 28.
SARS-CoV-2 is still circulating in the community. I think Governor Inslee has made the right decision to go slow on “re-opening.”
The positivity rate is an imperfect indicator of the actual infection rate in the general population. Given the total number of confirmed cases (14,327) and assuming that ten times as many people are actually infected (143,000), that’s an overall infection rate of 2%. Normally, a disease doesn’t slow down until the infection rate is 50% to 60% (so-called herd immunity). Two percent is insignificant and SARS-CoV-2 could easily “burn” through the population if it is left unchecked.
Are we heading toward 1918, again?
The Centers for Disease Control and Prevention (CDC) site has an extensive section about the 1918 influenza pandemic in the United States. The pandemic was caused by an H1N1 virus. The disease was first identified in the United States during the spring of 1918, eventually killing 675,000 people in the U.S. The number of deaths worldwide is estimated at 50 million people.
Due to poor record keeping and other factors, a true accurate tally of infections and deaths is not possible. All figures are estimates.
If you’re at all familar with recent events in the United States, the 1918 pandemic timeline should make your hair stand on end.
March 1918: Outbreaks of the flu are first detected. This is the beginning of the first wave.
April 1918: Cases and deaths are reported by public health officials.
Summer 1918: The first wave crests and declines.
September 1918: The second wave emerges.
October 1918: 195,000 Americans are killed by the virus during October alone.
November 1918: The fatal second wave subsides. America celebrates World War I Armistice (parades, etc.) setting up a third wave of infection.
December 1919: A third wave begins.
April 1919: The third wave subsides.
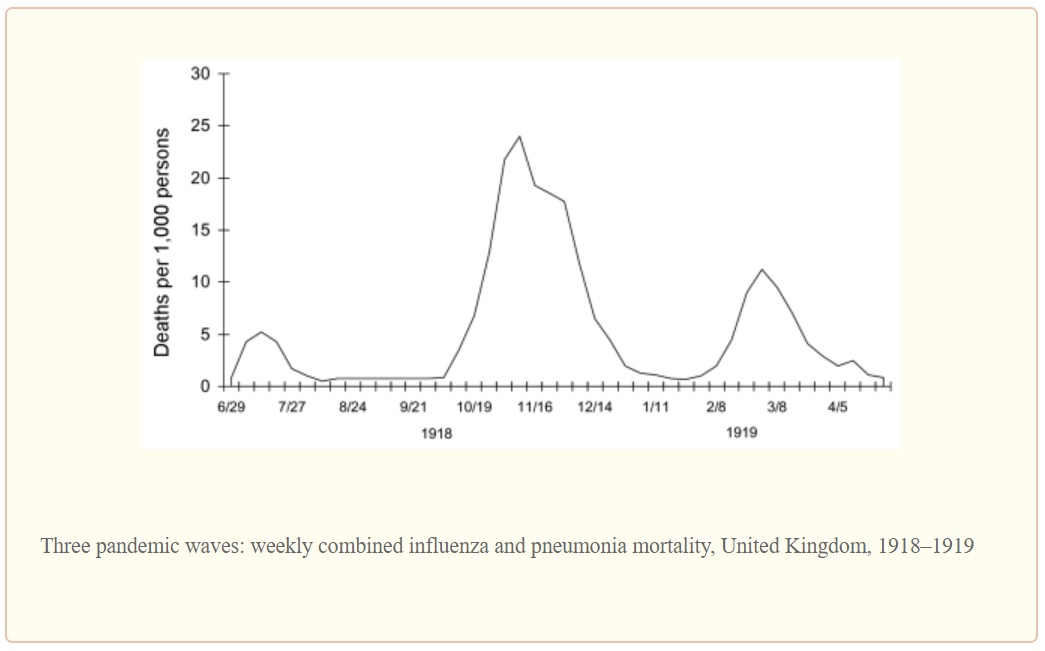
The second wave was the most deadly wave and was responsible for most of the losses in the U.S. The timing is eerily similar to the COVID-19 outbreak in the U.S.
The graph below illustrates the lethality of the three waves (as measured in the United Kingdom).
1918 Influenza: The Mother of All Pandemics, Taubenberger and Morens, January 2006
Barely two months into the COVID-19 pandemic, seventeen states are reopening partially and six states are lifting orders or reopening soon. [The New York Times, May 1, 2020] Some of the states have not satisfied the WhiteHouse/CDC gating criteria for reopening.
I fear that this is too soon to declare victory or to even imagine a return to a normal (pre-pandemic) state of affairs in one or two months. Dr. Anthony Fauci (NIH), Dr. Robert Redfield (CDC) and other health officials have warned about a second wave in Fall 2020. Be assured, SARS-CoV-2 will continue to circulate in the population during the summer months just like the 1918 H1N1 influenza virus. The American populace is just as vulnerable to an COVID-19 outbreak as it was in January 2020.
I genuinely hope and pray that we haven’t set outselves up for an extremely fatal second wave of COVID-19. Are we doomed to repeat history?
Stay the course and stay healthy — P.J. Drongowski