ARM Cortex-A72 tuning: Branch mispredictions

Back on the old day job, I developed and tested software and hardware for program profiling. Testing may sound like drudge-work, but there are ways to make things fun!

Two questions arise while testing a profiling infrastructure — software plus hardware:

  • Does the hardware accurately count (or sample) performance events for a given specific workload?
  • Does the software accurately display the counts or samples?

Clearly, ya need working hardware before you can build working software.

Testing requires a solid, known-good (KG) baseline in order to decide if new test results are correct. Here’s one way to get a KG baseline — a combination of static analysis and measurement:

  • Static analysis: Analyze the post-compilation machine code and predict the expected number of instruction retires, cache reads, misses, etc.
  • Measurement: Run the code and count performance events.
  • Validation: Compare the measured results against the predicted results.

Thereafter, one can compare new measurements taken from the system under test (SUT) and compare against both predicted results and baseline measured results.

Applying this method to performance counter counting mode is straightforward. You might get a little “hair” in the counts due to run-to-run variability, however, the results should be well-within a small measurement error. Performance counter sampling mode is more difficult to assess and one must be sure to collect a statistically significant number of samples within critical workload code in order to have confidence in a result.

One way to make testing fun is to make it a game. I wrotekernel programs that exercised specific hardware events and analyzed the inner test loops. You could call these programs “test kernels.” The kernels are pathologically bad (or good!) code which triggers a large number of specific performance events. It’s kind of a game to write such bad code…

The expected number of performance events is predicted through machine code level complexity analysis known as program “microanalysis.” For example, the inner loops of matrix multiplication are examined and, knowing the matrix sizes, the number of retired instructions, cache reads, branches, etc. are computed in closed form, e.g.,

    (38 inner loop instructions) * (1,000,000,000 iterations) + 
(26 middle loop instructions) * (1,000,000 iterations) +
(9 outer loop instructions) * (1,000 iterations)
-----------------------------------------------------------
38,026,009,000 retired instructions expected
38,227,831,497 retired instructions measured

This formula is the closed form expression for the retired instruction count within the textbook matrix multiplication kernel. The microanalysis approach worked successfully on Alpha, Itanium, x86, x64 and (now) ARM. [That’s a short list of machines that I’ve worked on. 🙂 ]

With that background in mind, let’s write a program kernel to deliberately cause branch mispredictions and measure branch mispredict events.

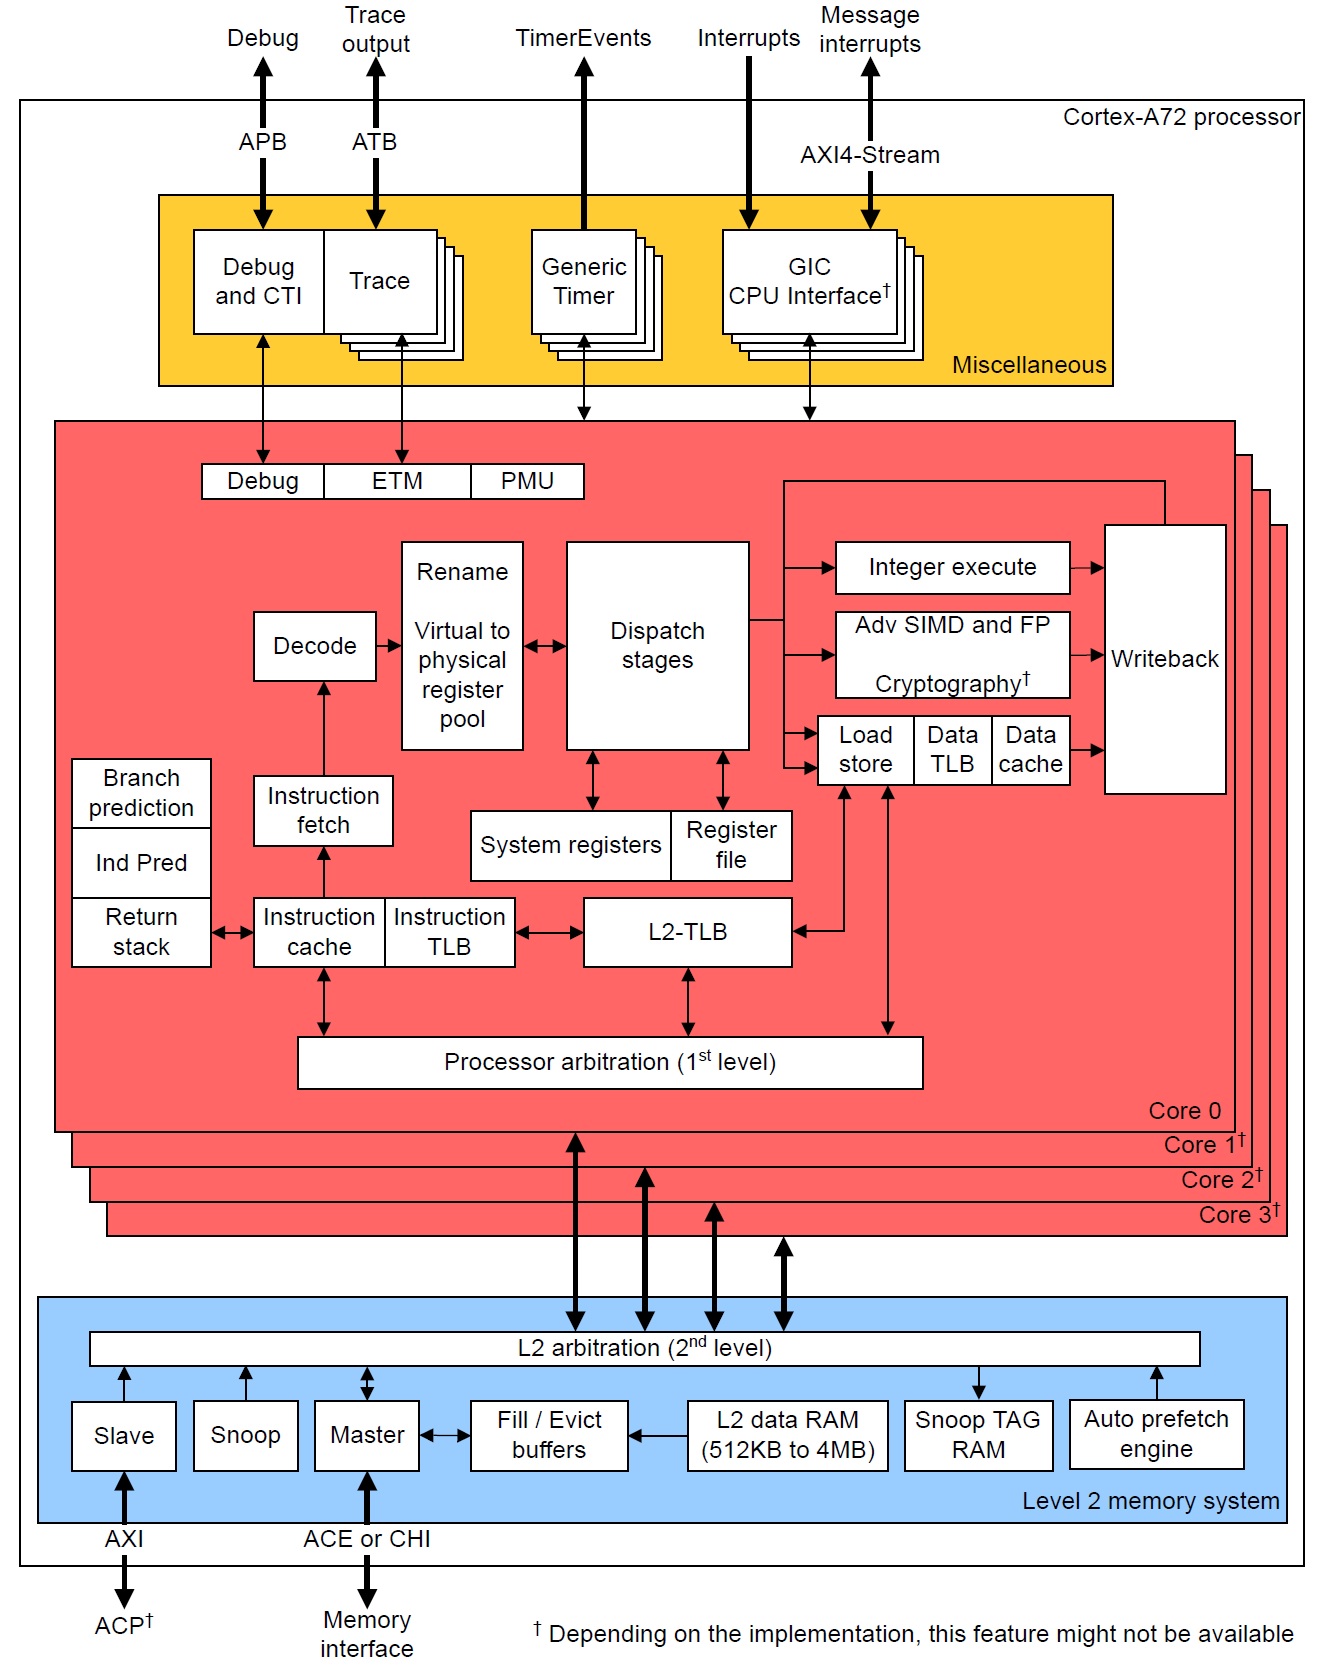
The ARM Cortex-A72 core predicts conditional branch direction in order to aggressively prefetch and dispatch instructions along an anticipated program path before the actual branch direction is known. A branch mispredict event occurs when the core detects a mistaken prediction. Micro-ops on the wrong path must be discarded and the front-end must be steered down the correct program path. The Cortex-A72 mispredict penalty is 15 cycles.

What we need is a program condition that consistently fools the Cortex-A72 branch prediction hardware. Branch predictors try to remember a program’s tendency to take or not take a branch and the predictors are fairly sensitive; even a 49%/51% split between taken and not taken has a beneficial effect on performance. So, we need a program condition which has 50%/50% split with a random pattern of taken and not taken direction.

Here’s the overall approach. We fill a large array with a random pattern of ‘0’ and ‘1’ characters. Then, we walk through the array and count the number of ‘1’ characters. The function initialize_test_array() fills the array with a (pseudo-)random pattern of ones and zeroes:

void initialize_test_array(int size, char* array, 
int always_one, int always_zero)
{
register char* r = array ;
int s ;
for (s = size ; s > 0 ; s--) {
if (always_one) {
*r++ = '1' ;
} else if (always_zero) {
*r++ = '0' ;
} else {
*r++ = ((rand() & 0x1) ? '1' : '0') ;
}
}
}

The function has options to fill the array with all ones or all zeroes in case you want to see what happens when the inner conditional branch is well-predicted. BTW, I made the array 20,000,000 characters long. The size is not especially important other than the desire to have a modestly long run time.

The function below, test_loop(), contains the inner condition itself:

int test_loop(int size, char* array) 
{
register int count = 0 ;
register char* r = array ;
int s ;
for (s = size ; s > 0 ; s--) {
if (*r++ == '1') count++ ; // Should mispredict!
} return( count ) ;
}

The C compiler translates the test for ‘1’ to a conditional branch instruction. Given an array with random ‘0’ and ‘1’ characters, we should be able to fool the hardware branch predictor. Please note that the compiler generates a conditional branch for the array/loop termination condition, s > 0. This conditional branch should be almost always predicted correctly.

The function run_the_test() runs the test loop:

void run_the_test(int iteration_count, int array_size, char* array) 
{
register int rarray_size = array_size ;
register char* rarray = array ;
int i ;
for (i = iteration_count ; i-- ; ) {
test_loop(array_size, array) ;
}
}

It calls test_loop() many times as determined by iteration_count. Redundant iterations aren’t strictly necessary when taking measurements in counting mode. They are needed, however, in sampling mode in order to collect a statistically significant number of performance event samples. I set the iteration count to 200 — enough to get a reasonable run time when sampling.

The test driver code initializes the branch condition array, configures the ARM Cortex-A72 performance counters, starts the counters, runs the test loop, stops the counters and prints the performance event counts:

initialize_test_array(array_size, array, always_one, always_zero) ; 
a72MeasureInstructionEvents() ;
peStartCounting() ;
run_the_test(iteration_count, array_size, array) ;
peStopCounting() ;
a72PrintInstructionEvents(stdout) ;

The four counter configuration, control and display functions are part of a small utility module that I wrote. I will explain the utility module in a future post and will publish the code, too.

Finally, here are the measurements when scanning an array holding a random pattern of ‘0’ and ‘1’ characters:

    Instructions ret'd:      45,999,735,845 
Instructions spec'd: 98,395,483,123
CPU cycles: 59,010,851,259
Branch speculated : 8,012,669,711
Branch mispredicted: 2,001,934,251
Branch predicted 8,012,669,710
Instructions per cycle: 0.780
Retired/spec'd ratio: 0.467
Branches per 1000 (PTI): 174.189
Branch mispredict ratio: 0.250

Please recall that there are two conditional branches in the inner test loop: a conditional branch to detect ‘1’ characters and a conditional branch to check the array/loop termination condition. The loop check should be predicted correctly almost all the time, accounting for 50% of the total number of correctly predicted branches. The character test, however, should be incorrectly predicted 50% of the time. It’s like guessing coin flips — you’ll be right half the time on average. Overall, 25% of branch predictions should be incorrect, and yes, the measured branch mispredict ratio is 0.250 or 25%.

The number of speculated instructions is also very interesting. Cortex-A72 speculated twice as many ARMv8 instructions as it retired. Over half of the speculated instructions did not complete architecturally and were discarded. That’s what happens when a conditional branch is grossly mispredicted!

I hope you enjoyed this simple experiment. It makes the Cortex-A72 fetch and branch prediction behavior come alive. As a follow-up experiment, I suggest trying all-ones or all-zeroes.

Please check out other articles in this series:

Don’t forget my Performance Events for Linux tutorial and learn to make your own Raspberry Pi 4 (Broadcom BCM2711) performance measurements.

Copyright © 2021 Paul J. Drongowski

ARM Cortex-A72 branch-related performance events:

 Number Mnemonic          Event name
------ ---------------- -----------------------------------------
0x08 INST_RETIRED Instruction architecturally executed
0x10 BR_MIS_PRED Mispredicted or not predicted branches
0x11 CPU_CYCLES Processor cycles
0x12 BR_PRED Predictable branch speculatively executed
0x1B INST_SPEC Operation speculatively executed
0x76 PC_WRITE_SPEC Software change of the PC (speculative)
0x78 BR_IMMED_SPEC Immediate branch (speculative)
0x79 BR_RETURN_SPEC Procedure return (speculative)
0x7A BR_INDIRECT_SPEC Indirect branch (speculative)

Disassembled code for test_loop():

00010678 :
10678: e92d0830 push {r4, r5, fp}
1067c: e28db008 add fp, sp, #8
10680: e24dd014 sub sp, sp, #20
10684: e50b0018 str r0, [fp, #-24] ; 0xffffffe8
10688: e50b101c str r1, [fp, #-28] ; 0xffffffe4
1068c: e3a04000 mov r4, #0
10690: e51b501c ldr r5, [fp, #-28] ; 0xffffffe4
10694: e51b3018 ldr r3, [fp, #-24] ; 0xffffffe8
10698: e50b3010 str r3, [fp, #-16]
1069c: ea000008 b 106c4
106a0: e1a03005 mov r3, r5
106a4: e2835001 add r5, r3, #1
106a8: e5d33000 ldrb r3, [r3]
106ac: e3530031 cmp r3, #49 ; 0x31
106b0: 1a000000 bne 106b8 ; Should mispredict!
106b4: e2844001 add r4, r4, #1
106b8: e51b3010 ldr r3, [fp, #-16]
106bc: e2433001 sub r3, r3, #1
106c0: e50b3010 str r3, [fp, #-16]
106c4: e51b3010 ldr r3, [fp, #-16]
106c8: e3530000 cmp r3, #0
106cc: cafffff3 bgt 106a0 ; Correctly predicted
106d0: e1a03004 mov r3, r4
106d4: e1a00003 mov r0, r3
106d8: e24bd008 sub sp, fp, #8
106dc: e8bd0830 pop {r4, r5, fp}
106e0: e12fff1e bx lr

Cortex-A72 tuning: Data access

In my discussion about instructions per cycle as a performance metric, I compared the textbook implementation of matrix multiplication against the loop next interchange version. The textbook program ran slower (28.6 seconds) than the interchange version (19.6 seconds). The interchange program executes 2.053 instructions per cycle (IPC) while the textbook version has a less than stunning 0.909 IPC.

Let’s see why this is the case.

Like many other array-oriented scientific computations, matrix multiplication is memory bandwidth limited. Matrix multiplication has two incoming data streams — one stream from each of the two operand matrices. There is one outgoing data stream for the matrix product. Thanks to data dependency, the incoming streams are more important than the outgoing matrix product stream. Thus, anything that we can do to speed up the flow of the incoming data streams will improve program performance.

Matrix multiplication is one of the most studied examples due to its simplicity, wide-applicability and familiar mathematics. So, nothing in this note should be much of a surprise! Let’s pretend, for a moment, that we don’t know the final outcome to our analysis.

I measured retired instructions, CPU cycles and level 1 data (L1D) cache and level 2 (L2) cache read events:

    Event                          Textbook     Interchange 
----------------------- -------------- --------------
Retired instructions 38,227,831,497 60,210,830,509
CPU cycles 42,068,324,320 29,279,037,884
Instructions per cycle 0.909 2.056
L1 D-cache reads 15,070,922,957 19,094,920,483
L1 D-cache misses 1,096,278,643 9,576,935
L2 cache reads 1,896,007,792 264,923,412
L2 cache read misses 124,888,097 125,524,763

There is one big take-away here. The textbook program misses in the data cache far more often than interchange. The textbook L1D cache miss ratio is 0.073 (7.3%) while the interchange cache miss ratio is 0.001 (0.1%). As a consequence, the textbook program reads the slower level 2 (L2) cache more often to find necessary data.

If you noticed slightly different counts for the same event, good eye! The counts are from different runs. It’s normal to have small variations from run to run due to measurement error, unintended interference from system interrupts, etc. Results are largely consistent across runs.

The behavioral differences come down to the memory access pattern in each program. In C language, two dimensional arrays are arranged in row-major order. The textbook program touches one operand matrix in row-major order and touches the other operand matrix in column-major order. The interchange program touches both operand arrays in row-major order. Thanks to row-major order’s sequential memory access, the interchange program finds its data in level 1 data (L1D) cache more often than the textbook implementation.

There is another micro-architecture aspect to this situation, too. Here are the performance event counts for translation look-aside buffer (TLB) behavior:

    Event                          Textbook     Interchange 
----------------------- -------------- --------------
Retired instructions 38,227,830,517 60,210,830,503
L1 D-cache reads 15,070,845,178 19,094,937,273
L1 DTLB miss 1,001,149,440 17,556
L1 DTLB miss LD 1,000,143,621 10,854
L1 DTLB miss ST 1,005,819 6,702

Due to the chosen matrix dimensions, the textbook program makes long strides through one of the operand matrices, again, due to the column-major order data access pattern. The stride is big enough to touch different memory pages, thereby causing level 1 data TLB (DTLB) misses. The textbook program has a 0.066 (6.6%) DTLB miss ratio. The miss ratio is near zero for the interchange version.

I hope this discussion motivates the importance of cache- and TLB-friendly algorithms and code. Please see the following articles if you need to brush up on ARM Cortex-A72 micro-architecture and performance events:

Check out my Performance Events for Linux tutorial and learn to make your own Raspberry Pi 4 (Broadcom BCM2711) performance measurements.

Here is a list of the ARM Cortex-A72 performance events that are most useful for measuring memory access (load, store and fetch) behavior. Please see the ARM Cortex-A72 MPCore Processor Technical Reference Manual (TRM) for the complete list of performance events.

Number  Mnemonic            Name 
------ ------------------ ------------------------------------
0x01 L1I_CACHE_REFILL Level 1 instruction cache refill
0x02 L1I_TLB_REFILL Level 1 instruction TLB refill
0x03 L1D_CACHE_REFILL Level 1 data cache refill
0x04 L1D_CACHE Level 1 data cache access
0x05 L1D_TLB_REFILL Level 1 data TLB refill
0x08 INST_RETIRED Instruction architecturally executed
0x11 CPU_CYCLES Processor cycles
0x13 MEM_ACCESS Data memory access
0x14 L1I_CACHE Level 1 instruction cache access
0x15 L1D_CACHE_WB Level 1 data cache Write-Back
0x16 L2D_CACHE Level 2 data cache access
0x17 L2D_CACHE_REFILL Level 2 data cache refill
0x18 L2D_CACHE_WB Level 2 data cache Write-Back
0x19 BUS_ACCESS Bus access
0x40 L1D_CACHE_LD Level 1 data cache access - Read
0x41 L1D_CACHE_ST Level 1 data cache access - Write
0x42 L1D_CACHE_REFILL_LD L1D cache refill - Read
0x43 L1D_CACHE_REFILL_ST L1D cache refill - Write
0x46 L1D_CACHE_WB_VICTIM L1D cache Write-back - Victim
0x47 L1D_CACHE_WB_CLEAN L1D cache Write-back - Cleaning
0x48 L1D_CACHE_INVAL L1D cache invalidate
0x4C L1D_TLB_REFILL_LD L1D TLB refill - Read
0x4D L1D_TLB_REFILL_ST L1D TLB refill - Write
0x50 L2D_CACHE_LD Level 2 data cache access - Read
0x51 L2D_CACHE_ST Level 2 data cache access - Write
0x52 L2D_CACHE_REFILL_LD L2 data cache refill - Read
0x53 L2D_CACHE_REFILL_ST L2 data cache refill - Write
0x56 L2D_CACHE_WB_VICTIM L2 data cache Write-back - Victim
0x57 L2D_CACHE_WB_CLEAN L2 data cache Write-back - Cleaning
0x58 L2D_CACHE_INVAL L2 data cache invalidate
0x66 MEM_ACCESS_LD Data memory access - Read
0x67 MEM_ACCESS_ST Data memory access - Write
0x68 UNALIGNED_LD_SPEC Unaligned access - Read
0x69 UNALIGNED_ST_SPEC Unaligned access - Write
0x6A UNALIGNED_LDST_SPEC Unaligned access
0x70 LD_SPEC Speculatively executed - Load
0x71 ST_SPEC Speculatively executed - Store
0x72 LDST_SPEC Speculatively executed - Load or store

Copyright © 2021 Paul J. Drongowski

Performance events on Raspberry Pi 4: Tips

Performance measurement and tuning experiments with Raspberry Pi 4 are well-underway. Here are a few quick observations and tips.

Linux provides two entries into performance measurement: Performance Events for Linux (PERF) and the kernel performance counter interface (perf_event_open()). PERF is an easy-to-use tool suite and is the best place to start explorations. If you want to measure an application without modifying its code, this is for you.

PERF is built on the kernel performance counter interface. The interface consists of two calls: perf_event_open() and its associated ioctl() functions. The kernel interface is suitable for self-monitoring, that is, adding calls to an application in order to measure its internal operation. Performance counters provide two modes of operation: counting and sampling. Counting mode is most appropriate for self-monitoring. I’m currently writing code that makes self-monitoring a bit easier and hope to post the code when it’s ready.

In the meantime…

Installation

PERF and perf_event_open support are not usually installed with your typical Linux distribution. Originally, PERF was available solely as part of the Linux tools package. Well, it seems like somewhere along the way, Ubuntu and Debian diverged. Ubuntu installs PERF with Linux tools:

    sudo apt-get install linux-tools-common 
sudo apt-get install linux-tools-common-$(uname -r)

As PERF depends heavily upon kernel facilities and interfaces, you should install the version of PERF that matches the installed kernel.

Raspberry Pi OS (once known as Raspian) is a Debian distro. Shucks, wouldn’t you know it, Debian installs PERF differently:

    sudo apt install linux-perf

There are different packages for buster and stretch (the current versions of Raspberry Pi OS and Debian at the time of this writing).

    https://packages.debian.org/buster/linux-perf 
https://packages.debian.org/stretch/linux-perf

Installing on buster produces output like:

    XXX@raspberrypi:~ $ sudo apt install linux-perf 
password for XXX:
Reading package lists… Done
Building dependency tree
Reading state information… Done
The following additional packages will be installed:
linux-perf-4.9
Suggested packages:
linux-doc-4.9
The following NEW packages will be installed:
linux-perf linux-perf-4.9
0 upgraded, 2 newly installed, 0 to remove and 107 not upgraded.
Need to get 1,275 kB of archives.
After this operation, 2,735kB of additional space will be used.
Do you want to continue? [Y/n]

Versioning gotcha

And, of course, it’s never that simple. My version of Raspberry Pi OS (buster) is expecting PERF version 5.4. When you enter “sudo perf list” or any other PERF command on the command line, the shell runs the script /usr/bin/perf. The script checks the version of PERF against the kernel and complains when versions don’t match. The Debian install pulled version 4.9, not 5.4.

Rather than sort out versioning, I’ve been entering “perf_4.9” instead of “perf“. This work-around bypasses the perf script which checks versions. Since PERF is now fairly mature, it all seems to work. At some point, I’ll sort out the versioning situation and install 5.4. In the meantime, full steam ahead!

Getting started

Here’s a few PERF commands to get you started:

    perf stat --help 
perf list sw
perf stat
perf top -a
perf top -e cpu_clock
perf record
perf report

The stat approach uses counting mode to measure software and hardware events triggered by an application program (“<cmd>”). The top approach displays event counts dynamically in real-time like the ever-popular “top” utility program. The record and report approach uses sampling to produce performance reports and profiles.

For additional usage information, check out the Linux performance analysis tutorial. There are several other fine tutorials and helpful sites on the Web. Many of the tutorials show use on x86 (Intel and AMD) systems, not Raspberry Pi and ARM. For that, I recommend my own three part tutorial:

  • Part 1 demonstrates how to use PERF to identify and analyze the hottest execution spots in a program. Part 1 covers the basic PERF commands, options and software performance events.
  • Part 2 introduces hardware performance events and demonstrates how to measure hardware events across an entire application.
    Part 3 uses hardware performance event sampling to identify and analyze hot spots within an application program.

In addition to usage, I offer information and guidance concerning ARM micro-architecture. This information is especially helpful when you get into hardware performance events. Check out my summaries of the ARM11 and ARM Cortex-A72 micro-architectures. ARM11 covers Raspberry Pi models 1, 2, and 3 (BCM2835 and BCM2836), while the Cortex-A72 summary covers the Raspberry Pi 4 (BCM2711).

Other helpful on-line resources are:

Paranoia!

Performance measurement is fraught with security issues and holes. The kernel developers implemented a control flag file, /proc/sys/kernel/perf_event_paranoid which sets the level of access and vulnerability when taking measurements. Quoting the Linux man page:

    The perf_event_paranoid file can be set to restrict access 
to the performance counters.
2 allow only user-space measurements (default since
Linux 4.6).
1 allow both kernel and user measurements (default
before Linux 4.6).
0 allow access to CPU-specific data but not raw
tracepoint samples.
-1 no restrictions.
The existence of the perf_event_paranoid file is the
official method for determining if a kernel supports
perf_event_open().

If you’re operating in a fairly closed, single-user environment, then set the content of the file to 0 or -1.

Read the perf_event_open() man page

I recommend reading the perf_event_open() man page. If you’re just starting your journey into performance measurement, you will be overwhelmed by the detail at first. However, just let the information wash over you and know that it’s there. The tutorials don’t always mention the perf_event_paranoid flag and other low-level details. Reading the man page should help you across future stumbling blocks and will enhance your understanding of events, counting and sampling.

Want to learn more about Raspberry Pi 4 (Cortex-A72 / Broadcom BCM2711) performance tuning? Please read:

Copyright © 2020 Paul J. Drongowski

Raspberry Pi 4 ARM Cortex-A72 processor

Raspberry Pi 4 (RPi4) is a big step beyond the earlier models 1, 2 and 3. Both desktop interaction and browsing are snappier and don’t have that laggy feel. I haven’t even thought (yet) about the RPi4’s music making and synthesis potential!

The Raspbeery Pi 4 is powered by a new processor from Broadcom: the BCM2711. The BCM2711 is an improvement over the BCM2835/2836 used in earlier models. Like the BCM2836, main memory is external. I’m running an RPi with 4GB of RAM (LPDDR4-3200 SDRAM, 3200Mb/s, dual channel). The old RPi2 has only 1GB of RAM. The BCM2711 supports Gigabit Ethernet (1000 BaseT) while the old RPi2 is just 100Megabit Ethernet. Faster Internet speed makes updates and browsing so much faster.

The RPi4 is a quad-core ARM Cortex-A72 processor clocking at 1.5GHz. The old RPi2 is a 900MHz quad-core ARM Cortex-A7 processor. The old BCM2835 is a member of the ARM11 family (ARM1176JZF-S, to be exact). The ARM Cortex-A72 within the BCM2711 has a much improved CPU core and memory subsystem.

The old ARM1176 is a relatively simple beast. It is a single issue machine, that is, it issues a single instruction per cycle. The ARM1176 core has eight pipeline stages and three execution pipes: 1. ALU, shift, saturation, 2. Multiply-accumulate, and 3. Load/store.

The Cortex-A72, on the other hand, performs 3-way instruction decoding and can issue as many as five operations per cycle. It is an out-of-order superscalar machine allowing speculative issue. That is waaay more sophisticated than the ARM1176, putting the Cortex-A72 on the same level as x86 superscalar machines. In fact, it translates ARM instructions into micro-ops like most modern x86 superscalar processors. It even performs micro-op fusion in some cases. The Cortex-A72 performs register renaming, letting micro-ops (instructions) execute when program data are ready (out-of-order execution, in-order retirement).

The Cortex-A72 issues micro-ops to eight execution pipelines:

  • Branch: Branch micro-ops
  • Integer 0: Integer ALU micro-ops
  • Integer 1: Integer ALU micro-ops
  • Integer Multi-Cycle: Integer shift-ALU, multiply, divide, CRC and sum-of-absolute differences micro-ops
  • FP/ASIMD 0: ASIMD ALU, ASIMD misc, ASIMD integer multiply, FP convert, FP misc, FP add, FP multiply, FP divide and crypto micro-ops
  • FP/ASIMD 1: ASIMD ALU, ASIMD misc, FP misc, FP add, FP multiply, FP square root and ASIMD shift micro-ops
  • Load: Load and register transfer micro-ops
  • Store: Store and special memory micro-ops

Up to 5-way issue and a larger number of independent execution pipelines permit more fine-grained parallelism than ARM1176. Of course, the compiler must know how to exploit all of this parallelism, but the potential is there. The ARM Cortex-A72 Software Optimization Guide specifies the number of execution cycles and pipeline units for each kind of ARM instruction. This information is incorporated into a compiler and guides the choice and scheduling of machine instructions.

ARM Cortex-A72 block diagram

The Cortex-A72 allows speculative execution. Without speculation, a CPU must wait at each conditional program branch until the direction is decided and instruction fetch can proceed along the chosen branch. The Core-A72 processor predicts branch direction (speculates) and aggressively issues instructions along predicted branches. The Cortex-A72 branch predictor is also improved over ARM1176. (I’m still digging into details.) If a branch is mispredicted, speculative results are discarded. So, it’s important to have a good branch predictor.

The Cortex-A72 can perform a load operation and a store operation every cycle because it has separate load and store pipelines. The ARMv8-A instruction set architecture (ISA) allows arbitrary data alignment and access. However, the Cortex-A72 hardware penalizes load operations that cross a cache-line (64-byte) boundary and store operations that cross a 16-byte boundary. Programmers (and compilers) should keep that in mind when laying down data structures in memory.

Like all modern high-performance computers, the Cortex-A72 organizes physical memory into a hierarchy with the fastest/smallest memory (registers) near the arithmetic/logic unit (ALU) and the slowest/largest memory (RAM) far away and off-chip. The registers and RAM are connected to intervening levels of memory — the caches:

          Register          Fast, but small 
|
Level 1 caches
|
Level 2 cache
|
RAM Big, but slow

Data and instructions are read (and written) in efficient chunks making data and instructions available when needed by the registers and ALU. The chunks are called “cache lines.” Thanks to cache memory, programs run faster when they (re)use data that are close together in memory (i.e., occupy the same cache line) and are the most recently accessed. These notions are called “spatial locality” and “temporal locality.”

The following table is a quick summary of the level 1 and level 2 cache structures of the ARM1176 and Cortex-A72.

Feature ARM1176 Cortex-A72
L1 I-cache capacity 16KB 48KB
L1 I-cache organization 4-way set associative, 32B line 3-way set associative, 64B line
L1 D-cache capacity 16KB 32KB
L1 D-cache organization 4-way set associative, 32B line 2-way set associative, 64B line
L2 cache capacity 128KB 1MB
L2 cache organization Shared, 8-way set associative, 64B line Shared, 16-way set associative, 64B line

Each core has an Instruction Cache (I-Cache) and Data Cache (D-Cache). The four cores share the Level 2 (L2) cache.

As you can see, the RPi4 (BCM2711) has larger caches and a bigger cache line size (64 bytes) than ARM11. RPi4 programs are more likely to find instructions and data in cache than earlier RPi models.

Contemporary processors have one or more memory management units (MMU) that break physical RAM into logical pages. This scheme is called “virtual memory.” The MMU translate logical program addresses (from loads, stores and instruction fetches) into physical RAM addresses. Address translation has its own memory hierarchy:

   Translation registers       Fast, but only a single mapping 
|
Level 1 TLBs
|
Level 2 TLB
|
RAM Big page tables, but slow

Page tables in RAM are maps that describe the layout of pages in the operating system and application programs. Translation lookaside buffers (TLB) are cache-like hardware structures that hold the most recently used (MRU) address translation information, i.e., where a logical page is located in physical memory. TLBs greatly speed up the translation process by keeping MRU page table information on-chip within the CPU.

Cortex-A72 has larger translation lookaside buffers (TLB) than ARM1176, as summarized in the table below. With larger TLBs, a program can touch more locations in memory without triggering a performance robbing page fault — an event which brings page translation information into the CPU from relatively slow RAM.

Feature ARM1176 Cortex-A72
D-MicroTLB capacity 10 entries 32 entries
D-MicroTLB organization Fully assoc, 1 lookup/cycle Fully assoc, 1 lookup/cycle
I-MicroTLB capacity 10 entries 48 entries
I-MicroTLB organization Fully assoc, 1 lookup/cycle Fully assoc, 1 lookup/cycle
L2 TLB capacity 256 entries 1024 entries
L2 TLB organization Unified, 2-way set assoc Unified, 4-way set assoc

Each core has a Data Micro-TLB (D-MicroTLB), Instruction Micro-TLB (I-MicroTLB), and Level 2 (L2) TLB. (In ARM1176 terminology, the L2 TLB is called the “Main TLB”).

In summary, the RPi4’s BCM2711 processor is a powerhouse even though it won’t knock that gaming machine off your desktop. 🙂 If you’ve been waiting to dive into Raspberry Pi or to upgrade, please don’t hesitate any longer.

I’m getting the itch to play with RPi4’s hardware performance counters and post results. In the meantime, check out my summary of the ARM11 micro-architecture. If you would like to know more about performance measurement and events in ARM1176-based Raspberry Pi’s, please see my Performance Events for Linux (PERF) tutorial.

Also, I have uploaded all of my teaching notes about computer design, VLSI systems and computer architecture:

These resources should help students and teachers alike!

Copyright © 2020 Paul J. Drongowski

Welcome CS teachers and students!

[Be sure to visit Living Computers in Seattle. SIGCSE 2017 attendees are admitted free during the conference. I visited the museum today and it was a lot of fun! K-12 teachers will enjoy the hands on exhibits.]

The annual ACM Special Interest Group on Computer Science Education (SIGCSE 2017) Technical Symposium is next week (March 8 – 11) in Seattle, Washington. The symposium brings together educators at all levels (K-12 and higher ed) to exchange and discuss the latest methods, practices and results in computer science education.

I don’t often advertise it, but the Sand, Software, Sound site has many resources for educators and students alike. You can browse these resources by clicking on one of the WordPress topic buttons (Raspberry Pi, PERF, Courseware, etc.) above. You can also search for a topic or choose from one of the categories listed in the right sidebar.

Here are a few highlights.

I taught many computer-related subjects during my career and have posted course notes, slides and old projects. The four main sections are:

  • CS2 data structures: Undergraduate data structures course suitable for advanced placement students.
  • Computer design: Undergraduate computer architecture and design which uses a multi-level modeling approach.
  • VLSI systems: Graduate course on VLSI architecture, design and circuits which is suitable for undergraduate seniors.
  • Topics in computer architecture: Material for a special topics seminar about computer architecture (somewhat historical).

Please feel free to dig through these materials and make use of them.

Software and hardware performance analysis formed a major thread throughout my professional life. I recommend reading my series of tutorials on the Linux PERF tool set for software performance analysis:

The ARM11 microarchitecture summary is background material for the PERF tutorial. Program profiling is a good way to bring computer architecture to life and to teach students how to analyze and assess the execution speed of their programs.

There are two additional tutorials and getting started guides for teachers and students working on Raspberry Pi:

Music technology and computer-based music-making have been two of my chief interests over the years. The Arduino section of the site has several of my past projects using the Arduino for music-making. You should also check out my recent blog posts about the littleBits synth modules and littleBits Arduino. Please click on the tags and links at the bottom of each post in order to chase down material.

You might also enjoy my tutorial on software synthesizers for Linux and Raspberry Pi. The tutorial is a getting started guide for musicians of all stripes — music teachers and students are certainly welcome, too!

PERF tutorial part 3 is now on-line

Just wrapped up Part 3 of the Linux-tools PERF tutorial.

The tutorial now consists of three parts. Part 1 covers the most basic PERF commands and shows how to find program hot-spots using software performance events. Part 2 discusses hardware performance events and performance counters, and demonstrates how to measure hardware performance events using PERF counting mode. Part 2 introduces several derived performance metrics like instructions per second (IPC) and applies these metrics to the sample application programs.

Part 3 is the newest addition to the tutorial series. It builds on parts 1 and 2, showing how to use hardware performance events and counter sampling to profile an application program. Part 3 discusses sampling period and frequency, the sampling process, overhead, statistical accuracy/confidence and other practical concerns.

I hope you find the PERF tutorial to be useful in your work! Although I produced the example data on the ARM-based Raspberry Pi, the commands and techniques will also work on x86.

PERF tutorial part 2 now available

Part 2 of a three part tutorial about Linux-tools PERF is now available.

Part 1 of the series shows how to find hot execution spots in an application program. It demonstrates the basic PERF commands using software performance events such as CPU clock ticks and page faults.

Part 2 of the series — just released — introduces hardware performance counters and events. I show how to count hardware events with PERF and how to compute and apply a few basic derived measurements (e.g., instructions per cycle, cache miss rate) for analysis. Part 3 is in development and will show how to use sampling to profile a program and to isolate performance issues in code.

All three parts of the series use the same simple, easy to understand example: matrix multiplication. One version of the matrix multiplication program illustrates the impact of severe performance issues and what to look for in PERF measurements. The issues are mitigated in the second, improved version of the program. PERF measurements for the improved program are presented for comparison.

The test platform is the latest second generation Raspberry Pi 2 running Raspbian Wheezy 3.18.9-v7+. The Raspberry Pi 2 has a 900MHz quad-core ARM Cortex-A7 (ARMv7) processor with 1GByte of primary memory. Although the tutorial series demonstrates PERF on Cortex-A7, the same PERF commands and analytical techniques can be employed on other architectures like x86.

A special note for Raspberry Pi users. The current stable distribution of Raspbian Wheezy — 3.18.7-v7+ February 2015 — does not support PERF hardware events. Full PERF support was enabled in a later, intermediate release and full PERF support should be available in the next stable release of Raspbian Wheezy. In the meantime, Raspberry Pi 2 users may profile their programs using PERF software events as shown in Part 1 of the tutorial. First generation Raspberry Pi users are also restricted to software performance events.

Brave souls may try rpi-update to upgrade to the latest and possibly unstable release. I recommend waiting for the next stable release unless you really, really know what you are doing and are willing to chance an unstable kernel with potentially catastrophic consequences.